

Explain the problem as you see it
As a team of biology researchers, we want to free-associate unstructured text, images, and drawings alongside our text nodes and supertagged nodes, using a free-form visual layout. We found ourselves continually drawing on a digital whiteboard side-by-side with the graph, and pasting in static images of content that was duplicated on the whiteboard, and once on the whiteboard that content was no longer editable, queryable, or connectable to other content.
Why is this a problem for you?
Because we are visual thinkers and learners, a diagrammatic/whiteboard type of playground is very important for us to input ideas and freely structure and restructure them as we go along. A visual representation that mixes images and nodes allows us to create a path (or diverging paths) from one node to the next, allows us to make new connections between nodes, and overlay our own "spatial coordinate system" specific to the task.
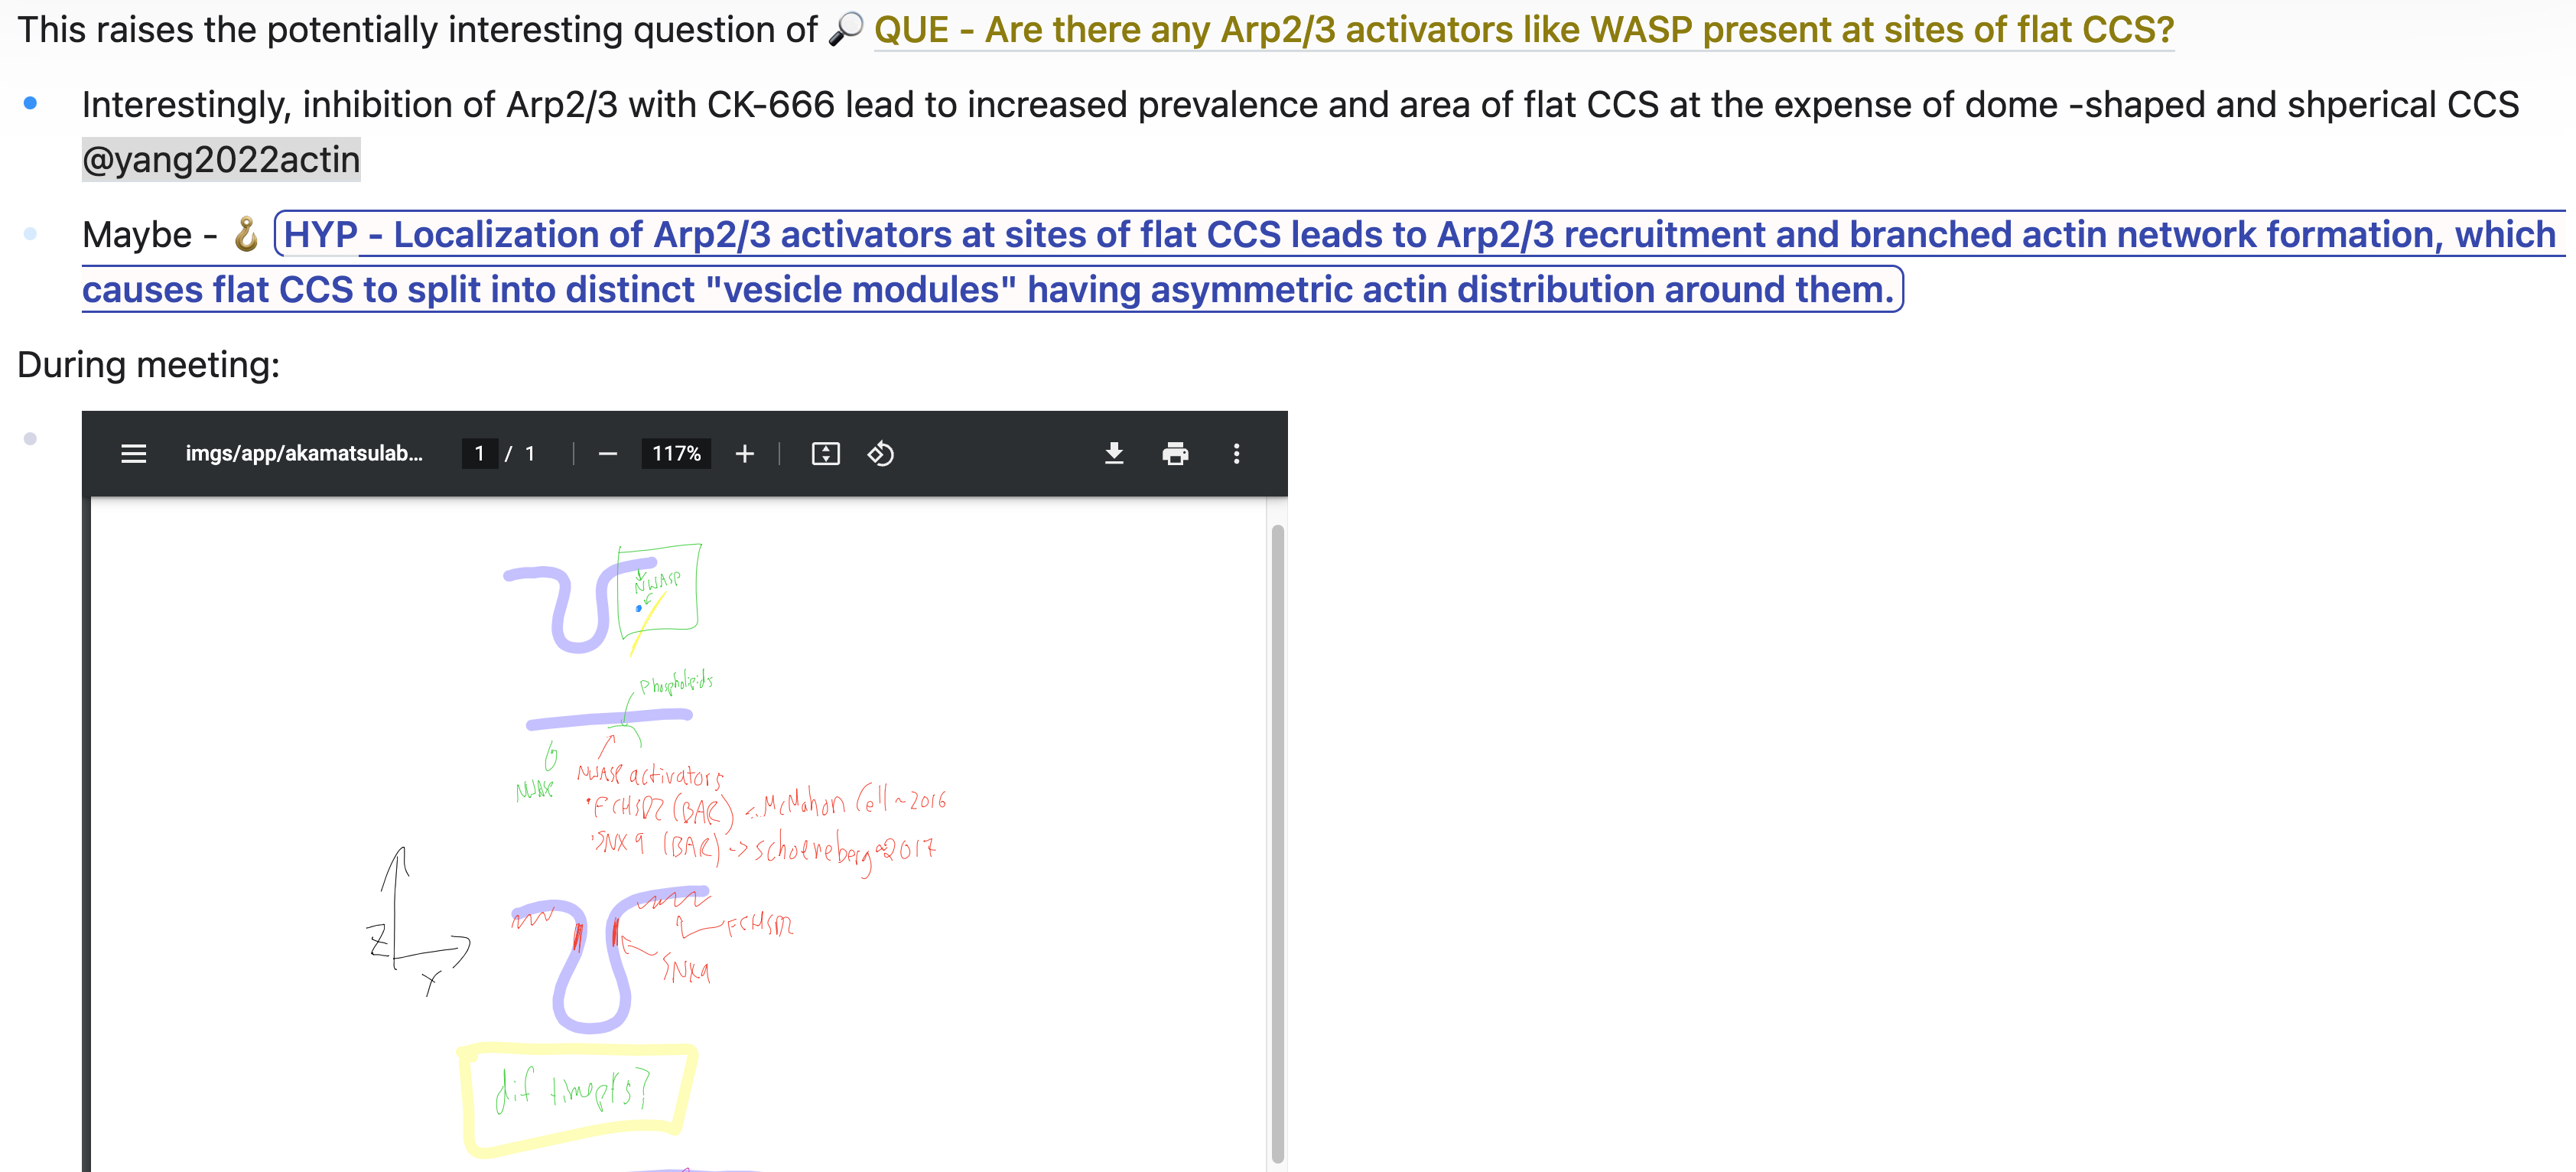
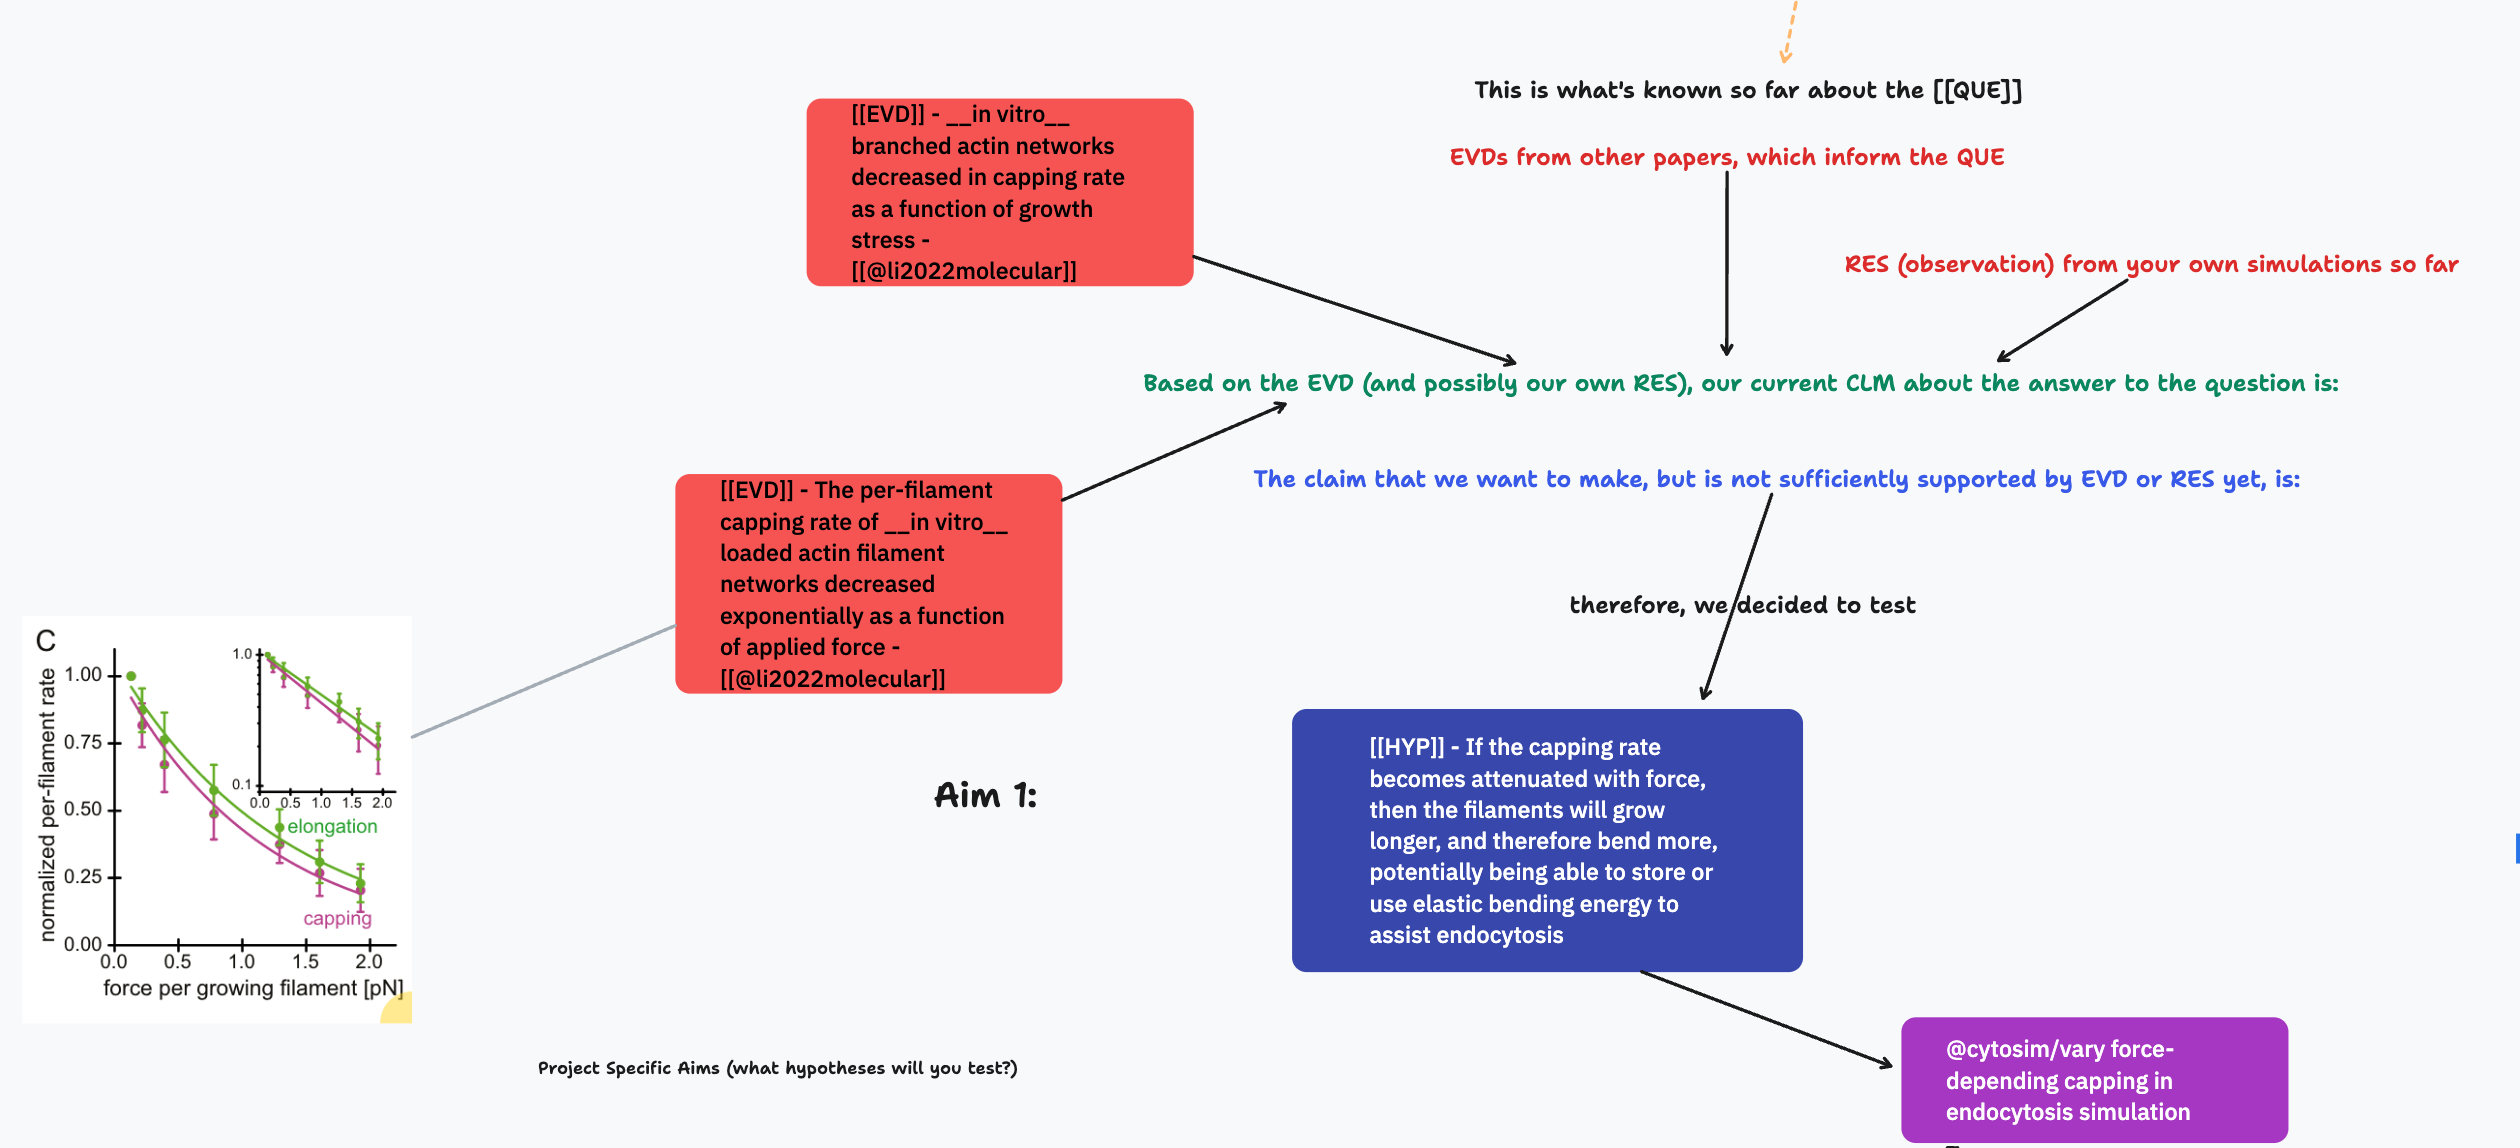
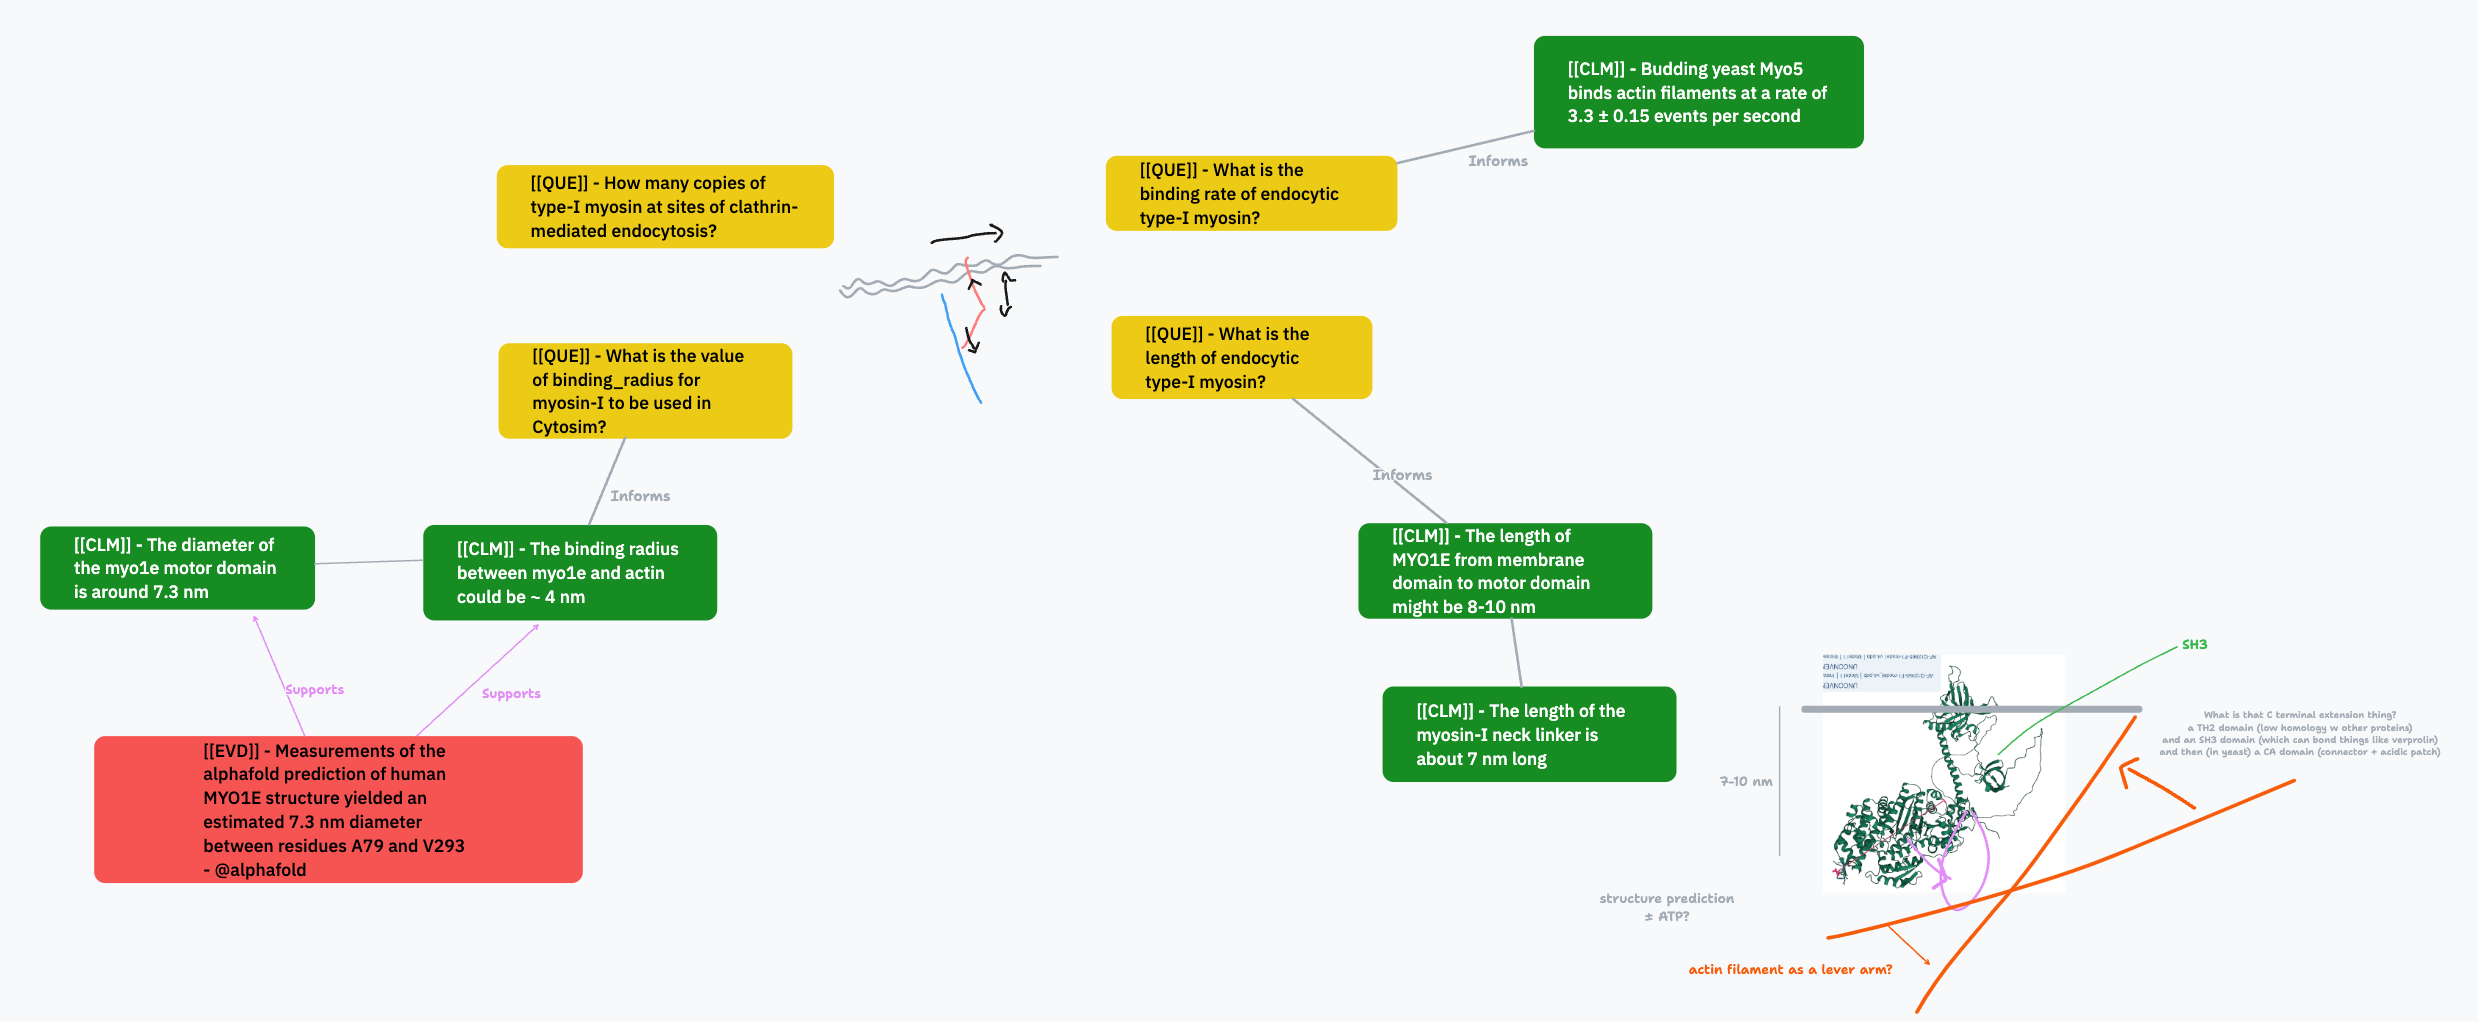
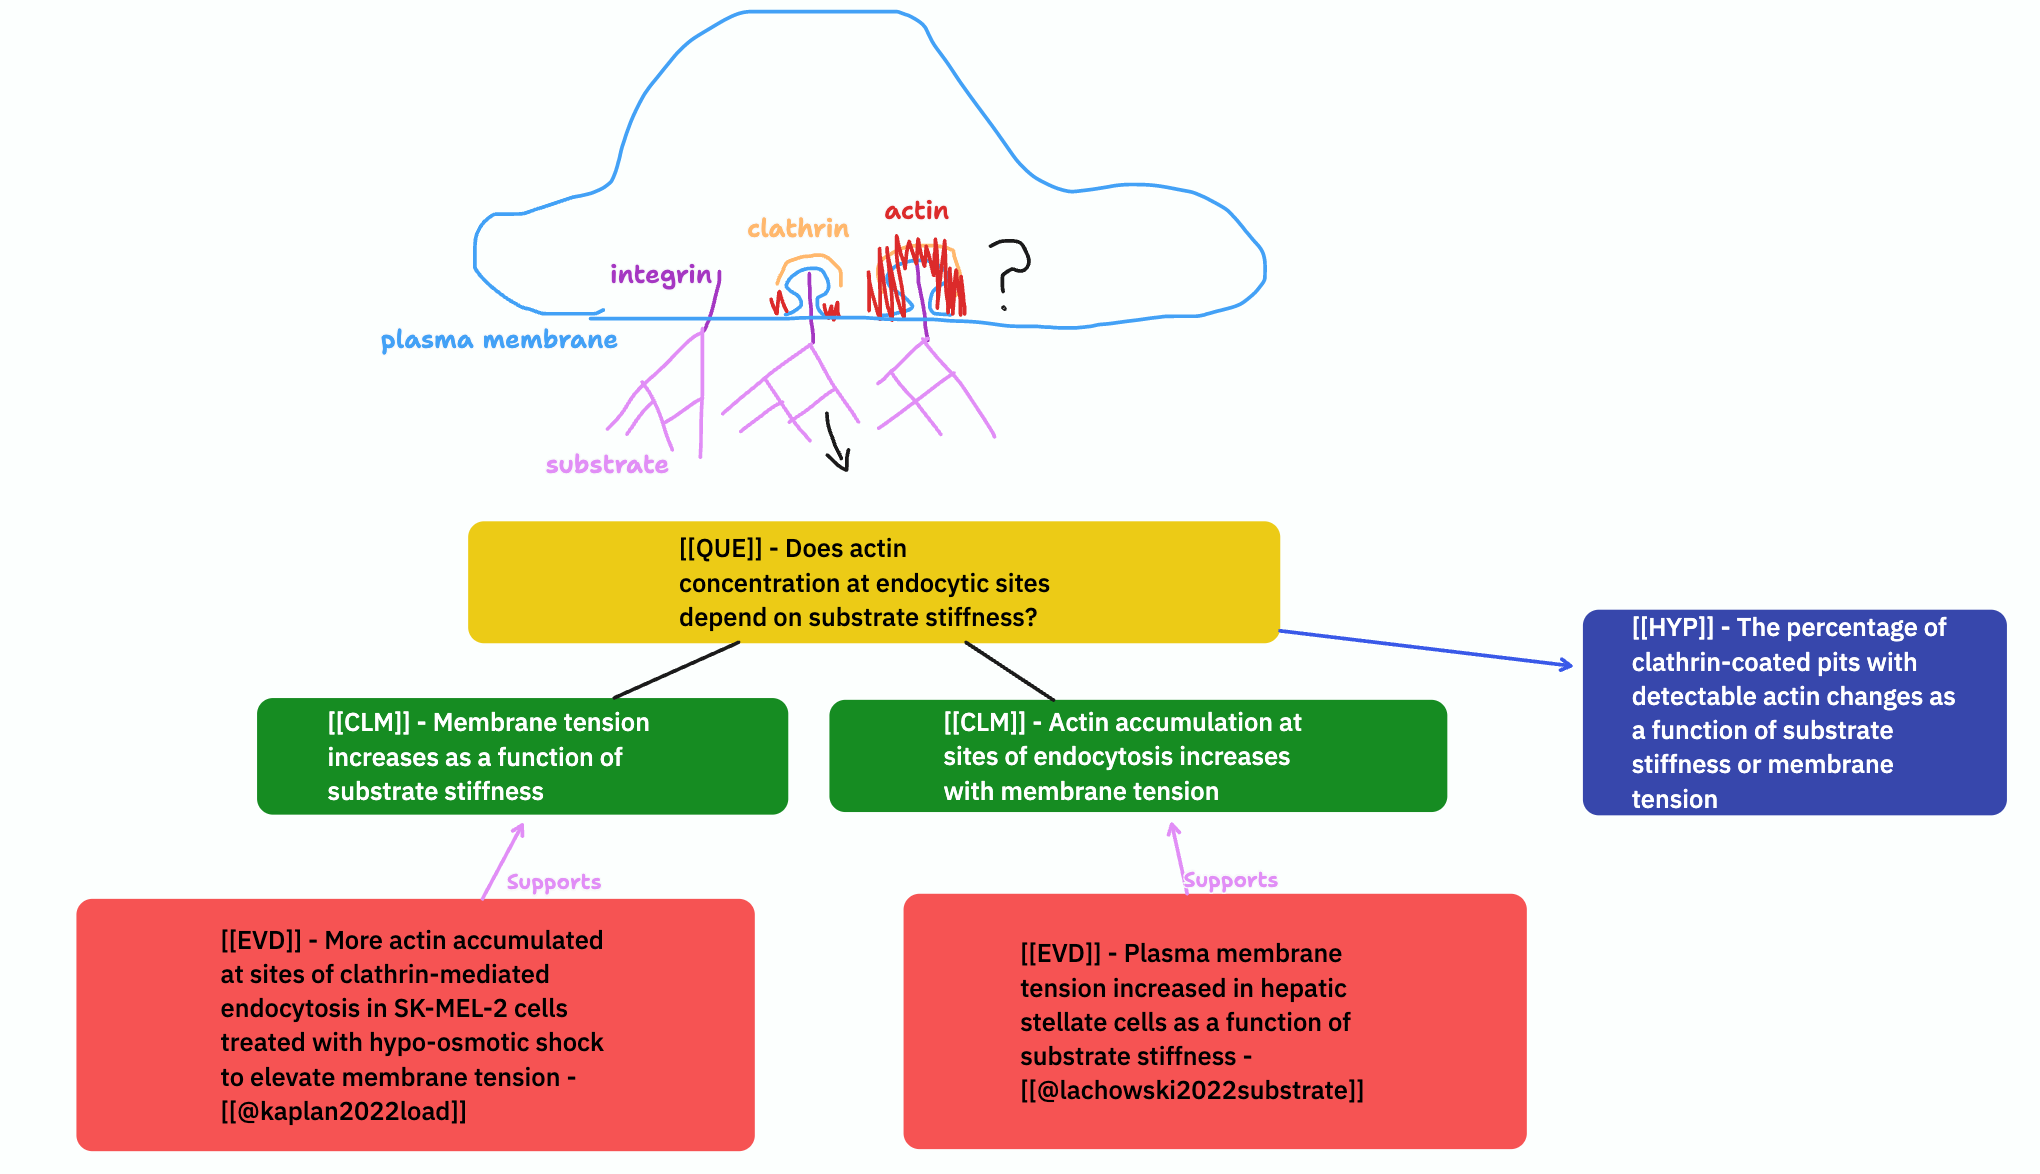
For example, If the task is to outline a research proposal, we'll include diverging paths depending on the outcome of a given experiment. If the task is to collect knowledge that informs the working model of a biological process, then we will include a drawing of the diagram alongside questions related to each element of the diagram.
Suggest a solution
We recently built an open-source canvas plugin for Roam Research that has these capabilities! It allows us to integrate freehand drawings, text, and shapes alongside content from the graph (nodes, pages, and the equivalent of supertagged nodes). It is built as a "canvas" option in the "query builder" roam research plugin: https://github.com/RoamJS/query-builder
David Vargas built this canvas on top of tldraw (similar to logseq's whiteboard) as part of his discourse graph plugin. We think it would be useful for visual thinkers of many types. Some of our favorite features include
select a given node type (supertag) to add
add an existing node of a specific type
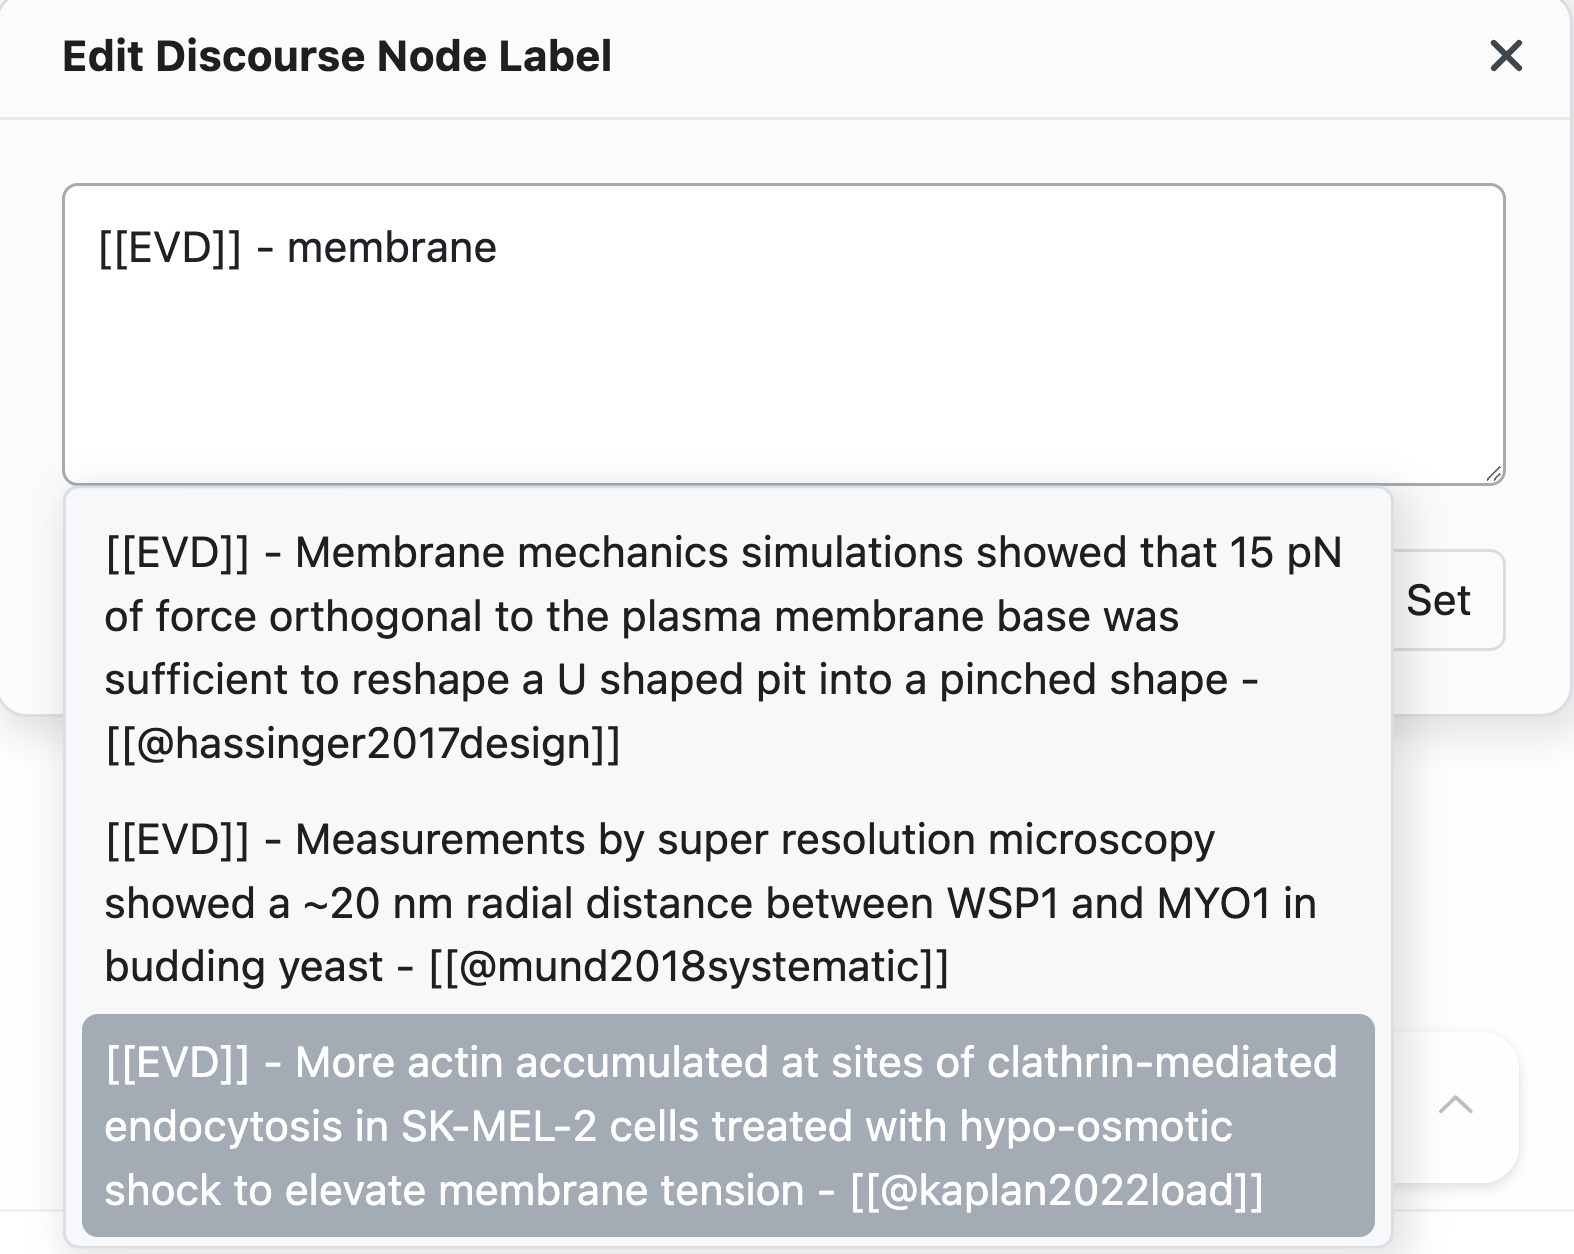
create a new node of a specific type
connect nodes
After talking with @Lukas/CortexFutura this morning, we think that a canvas like this is the only remaining feature that would be necessary for us to move our lab graph over from Roam.
If useful, we'd be happy for you to take freely from the plugin linked above, and we can share any lessons from the development of the canvas (which took approximately 30-40 hours of Vargas's time spread over 2 months or so).
13 Comments
Great idea! What I would LOOOOVE to see is a snappy mindmap feature where we can add existing or new nodes as branches to map out a project, or to brainstorm of course. A dream would also be to have something like Flying Logic (https://flyinglogic.com/) with its awesome rearranging of nodes as you think through causes and effects.
I would also like a way to visualize my notes—something like Scrintal or Heptabase
..
Logseq also has a whiteboard feature, maybe it uses the same tldraw implementation as the Roam plugin? Not sure.
The Logseq implementation is exactly what I was just about to point out. I really like the way that Logseq treats the Whiteboards as pages. They can me linked to, referenced, their content show up is search (and is also able to be referenced).
Whiteboards/Canvas are an essential tool.
I'll share my use case to display one way they function. When I read books I make a last as I read of all the salient points from the book. I bring this in as an list. Then from the list I pull the into a whiteboard. Here I begin to develop groupings, and the order them—generally moving them around to not only understand them better individually but also in relation to each other. Then from the whiteboard I can create an outline.
That is only the first step. I also have whiteboard for the top level areas of research that I'm intersted in. I can pull individual notes into areas where they will be relevant. And like the books boards, these boards will begin to develop groupings and orders. For example in the books I read I may find 30 notes about "writing" and 23 about "technology." I can bring them into the respective topic boards. And from that I will gain a deeper understanding of these topics through out all of my reading.
The whiteboards are key to this synthesis.
This should be merged with https://ideas.tana.inc/posts/114-visual-graph-visualize-and-manipulate-my-nodes-via-a-graph-view
^ I don't think these should be merged. Graph view != Canvas view, they are two separate features.
Agreed! I end up using Roam's (improved) graph view in different cases than the canvas.
A couple of updates:
One killer app has been to take the results of a query and dump them into a canvas.
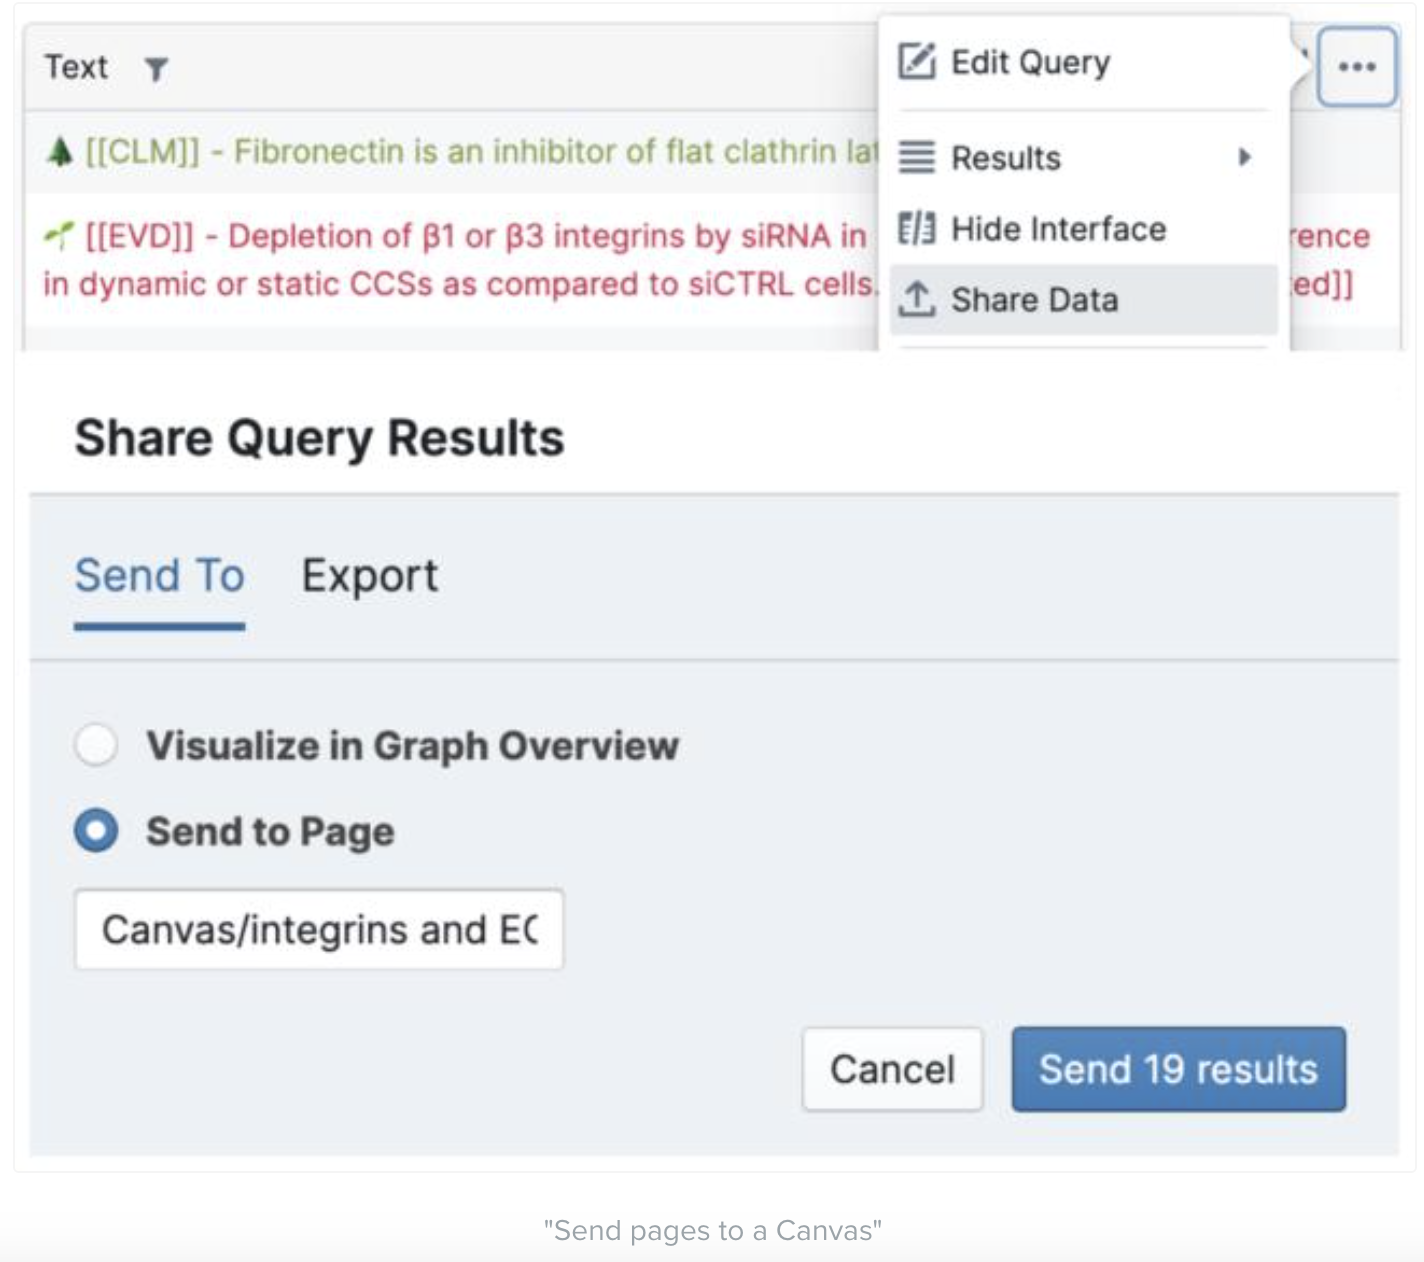
This lets us array e.g. a set of projects on the canvas and spatially categorize, etc.
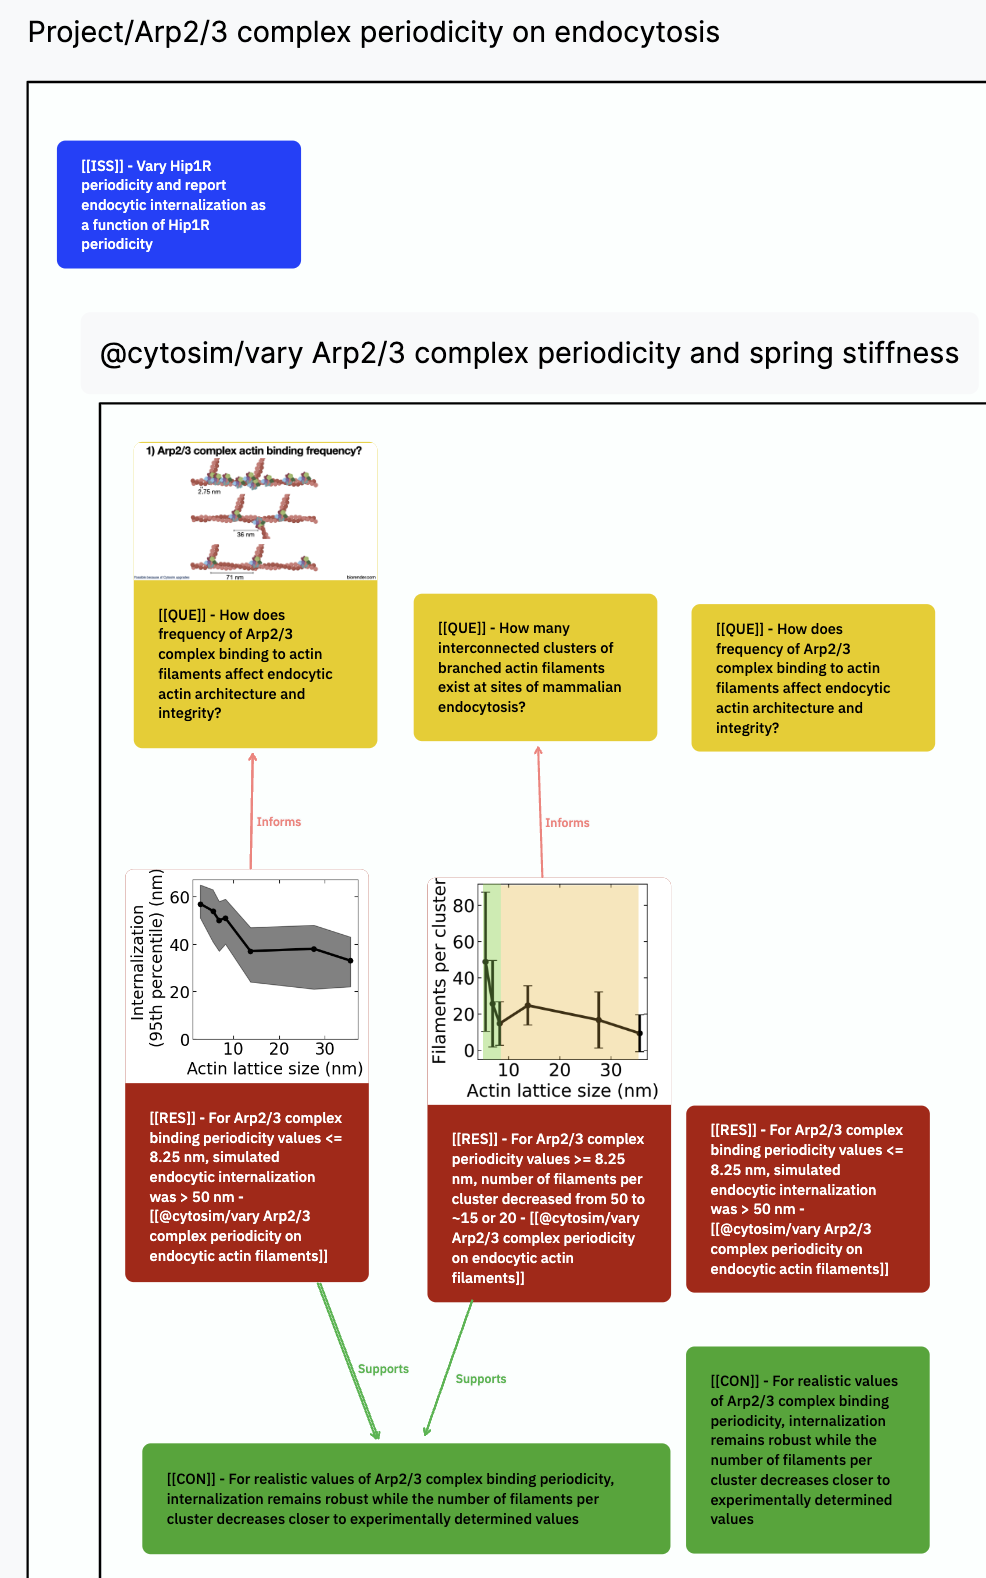
The canvas now includes "key figure" images which are pulled from the first image associated with the nodes. This has increased utility of the canvas by a lot!
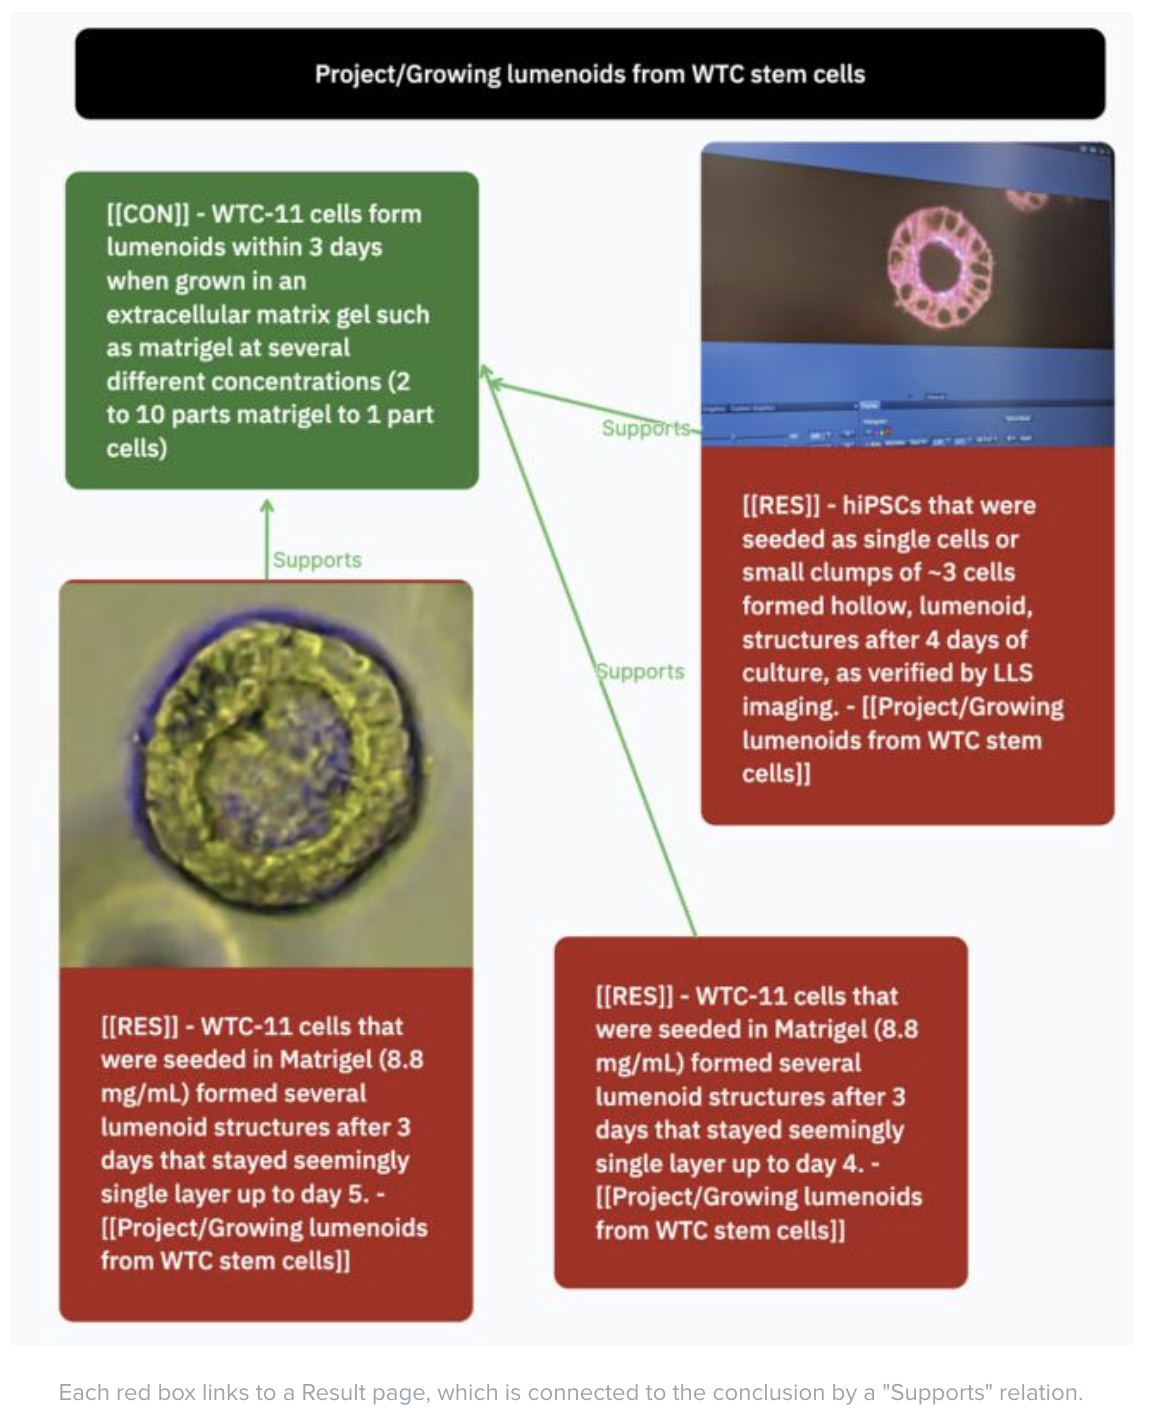
I wrote up some examples for how we use the canvas on experiment.com if useful!
Adding my voice here as well. Similar to the other thread which I commented here: https://ideas.tana.inc/posts/114-visual-graph-visualize-and-manipulate-my-nodes-via-a-graph-view/comments/1042
I'm a Visual-Spatial thinker and am currently researching Graph Views.
Graph Views in Obsidian have very poor utility because so many nodes are displayed. When filters are applied, you can see things but have no features to do anything about it, so there is no way to create more notes and change connections. The Canvas feature can do this but won't help you intelligently build the Graph; it's very manual. Better Graphs are found in Anytype and Capacities.io, but the winners are Scrintal and Heptabase. For a visual-spatial thinker, Scrintal wins because it can build abstraction on abstraction, just like Tana. Heptabase is unable to go down further than one layer, but it does have a superior visual editing tool and a better text editor. Heptabase also uses Tags in a similar way to Tana so that it can make a good companion.
Where my brain is going, Tana is a near-perfect outliner. Developing graphical abilities will be a distraction when the development bandwidth is better spent elsewhere, such as integration! Now, if Tana could integrate with Heptabase or Scrintal, this would be better as both dev teams could focus on their core strengths rather than development functionality away from its core mission. For me Tana as your database at the heart of a productivity ecosystem sounds like a better option.
One key for making the Canvas useful a more algorithmic way is a "send to canvas" function from a query. We built this in our Roam query builder plugin:
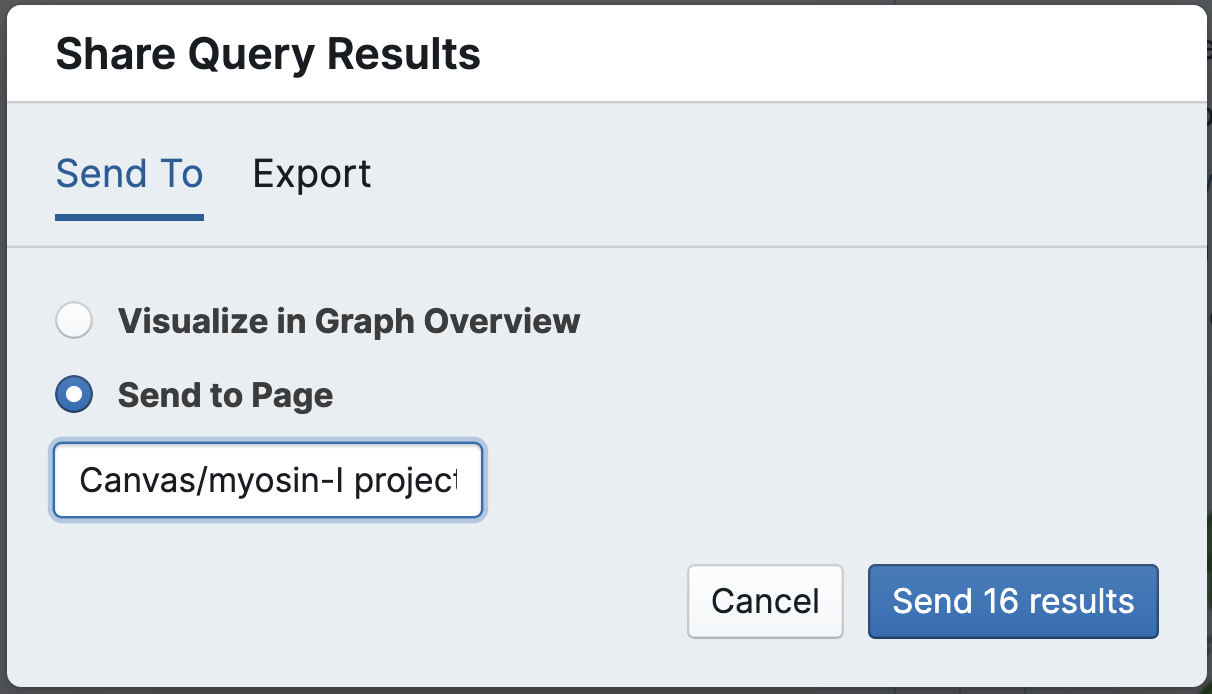
It's very powerful because we query e.g. all the nodes that were made after a certain day, by an author, with type X (or relation Y to those nodes), and send them all to the canvas. The nodes and relations remain updated as you change them in the outliner, and you get the ability to sort, add, and include handwriting in a nonlinear way.
@David Oliver , if you have found other advantages of Scrintal, let me know and I'll see if we can include those features in our plugin prototype. We'd be interested in building something similar that works with Tana, if they meet us halfway with plugin type support :)
Who else caught the tease of something like this during the SF meetup presentation!?

I really would like to add my voice to a whiteboard feature. I'm currently using a mix of Tana and Heptabase because I tend to think visually as well. So Tana becomes my main notebook, and when I need to think and work through a more complex topic, I switch to Heptabase. That's my current solution to this.
If Tana had a whiteboard/canvas feature, I'd be able to instantly drop Heptabase and only use Tana. That would be amazing!
Chiming in here.
I find that Tana is more suitable for people who link to think in terms of text, and relationships between text. Its good for pulling things together.
This is useful, but I am someone who really benefits from 'seeing' notes next to one another on a canvas and be able to move the 'objects' around the canvas. Doing so allows me to make connections and insights that otherwise would not be possible, AND it helps me to recall the information as I tend to see the board in my mind.
Are there any plans to include a canvas in the near future?