

Explain the problem as you see it
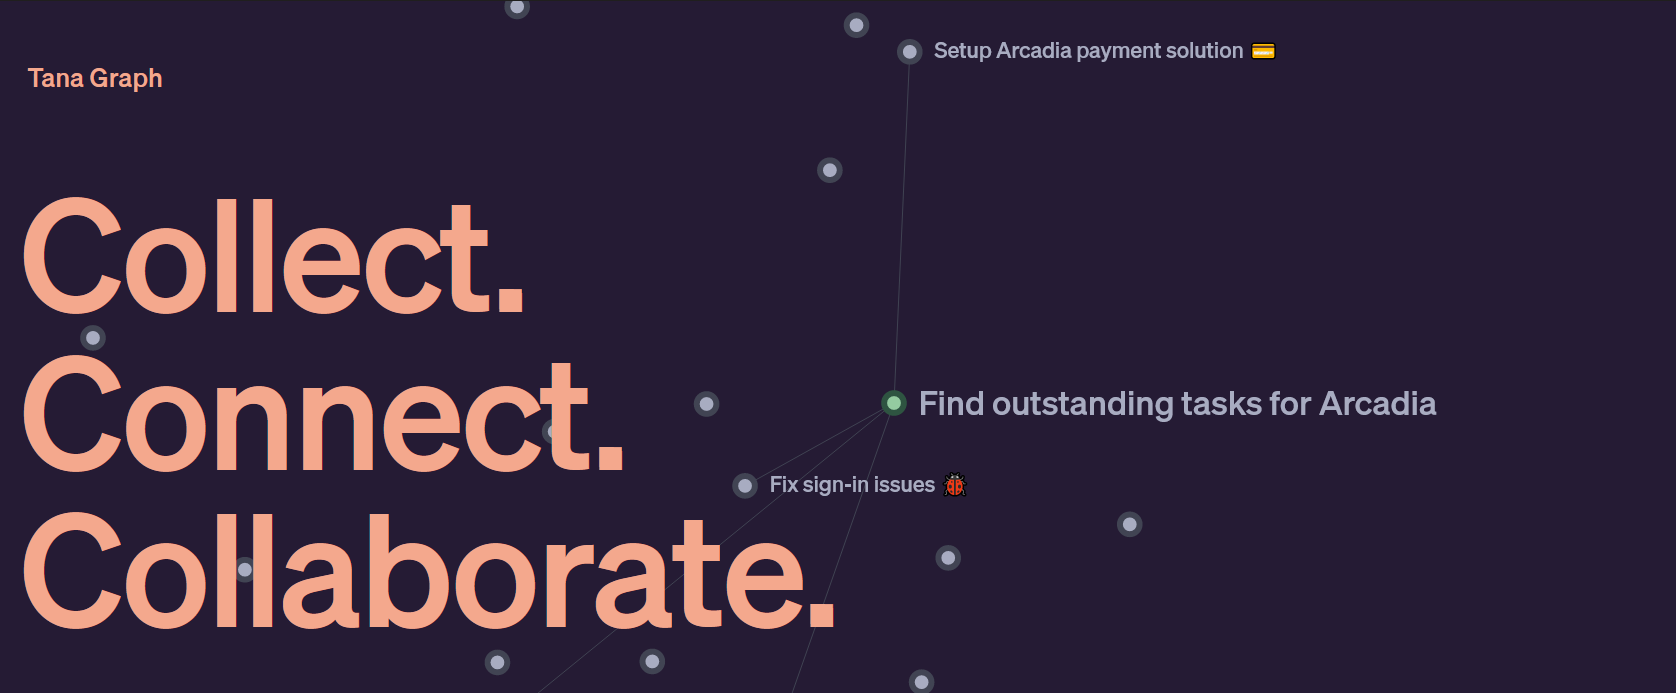
On the homepage there is a picture of a visual graph showing your nodes and the connections between them. But this feature is not available in the app.
Why is this a problem for you?
I am having a hard time seeing my connections between ideas, organizing, and synthesizing those ideas with just text.
One thing is to search and see connections as text. Another is to see my ideas from a higher-order view, to zoom-out, per se. I am trying to organize my ideas and see them as a bunch of nodes similar to actual schemas (neurons) is incredibly useful if done correctly.
Suggest a solution
Please give us a graph view that at minimum is used to visualize my nodes in a graph view and be able to manipulate (make new ones, delete others) the connections (links) and positions of the nodes.
I'd love to use this view to manipulate connections (links between nodes), I'd like this to be more useful than roam research which moves the nodes to some arbitrary order every time you go to this view. If I move a node to a specific position and leave, I want to go back and see the node where I left it.
In the future doing some things like Heptabase/infinitymaps would be amazing.
36 Comments
Other examples of potential visual solutions: TheBrain app, Excalibrain in Obsidian
Currently, I struggle to effectively organize and connect ideas, making it difficult to navigate between related concepts and brainstorm efficiently. The lack of a visual representation for ideas and connections limits my ability to intuitively understand the relationships between my thoughts, hindering the development of a cohesive knowledge ecosystem.
I've come across several implementations that seem quite interesting.
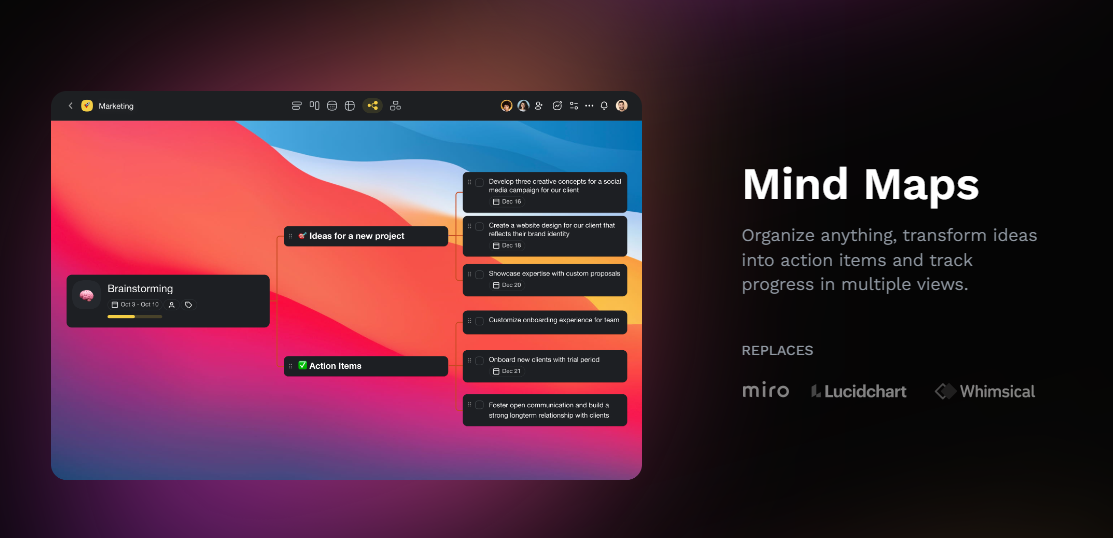
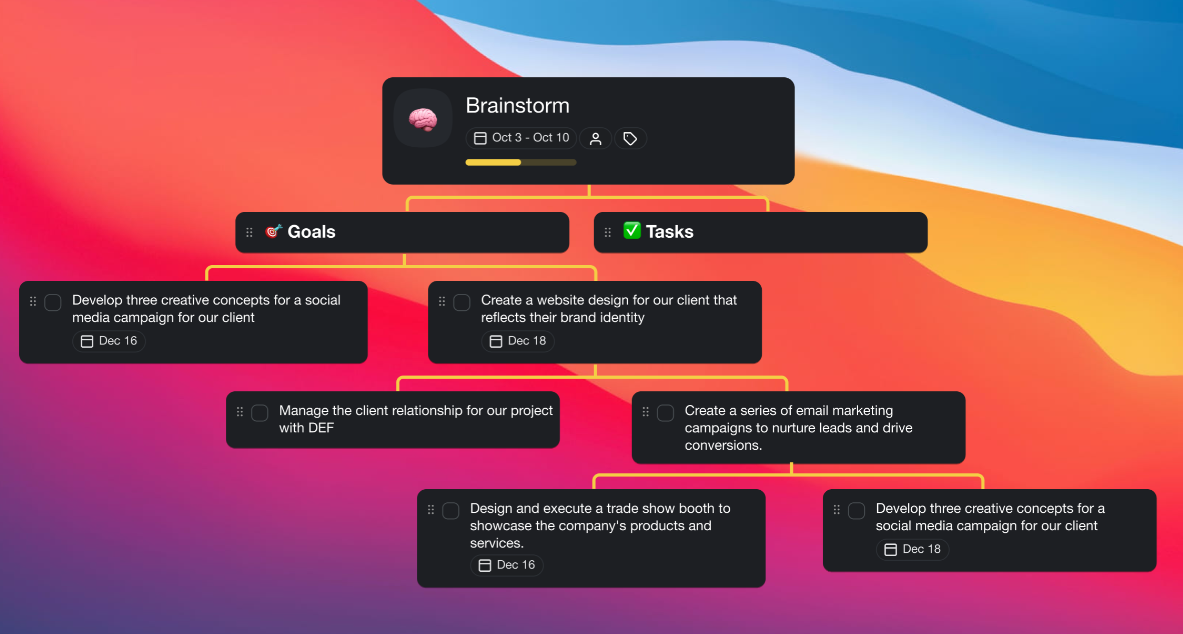
Taskade's Mindmaps
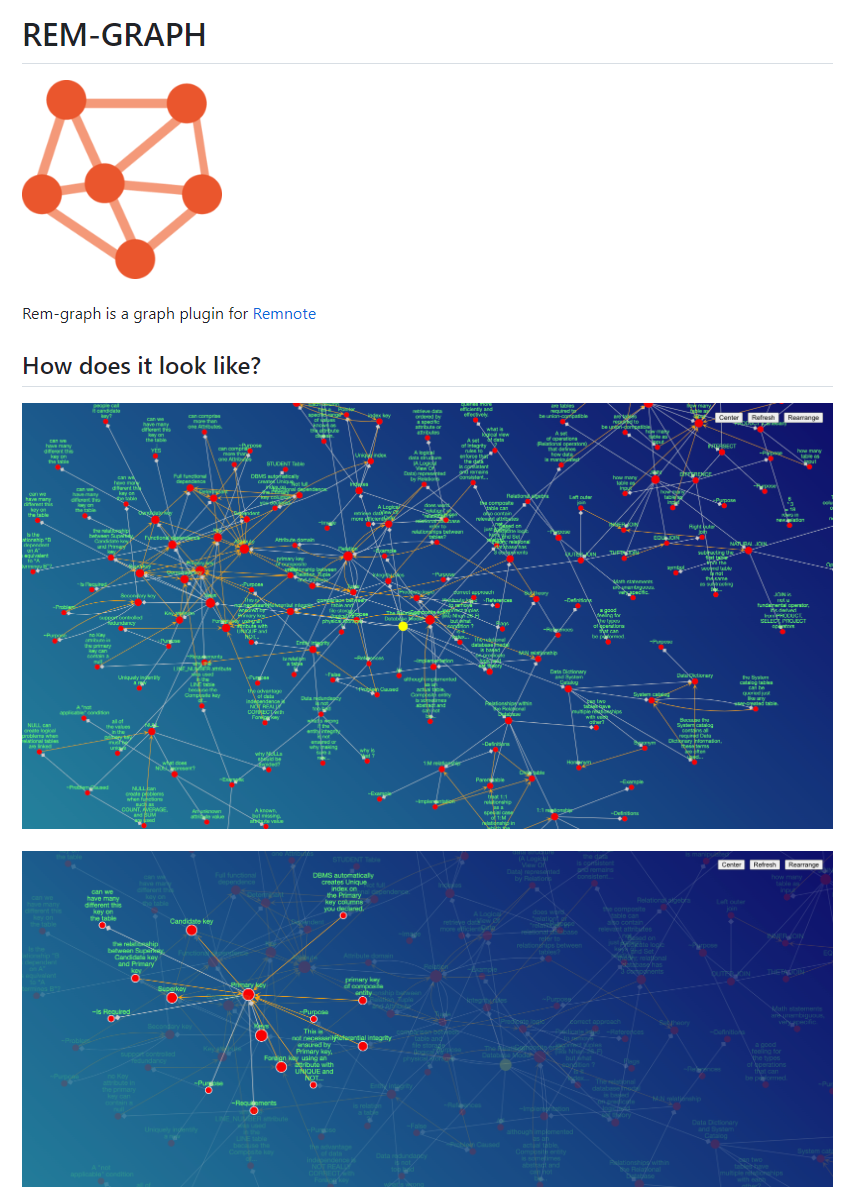
Remnote plugin: Rem-graph
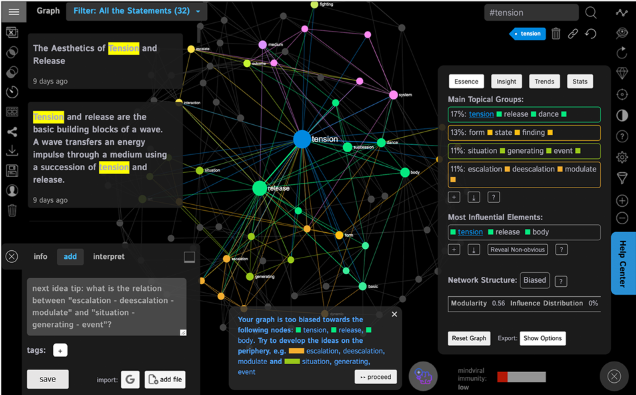
Infranodus graph
===
I think that Tana has to carefully consider this, because the graphical interface is something that is far more intuitive to the human mind than pure text.
The way many apps do it, like Logseq's whiteboard or Obsidian's canvas or Scrintal or Heptabase - they don't really seem to catch the essence of this... It's about the relationships created, not just the graphical representation of it. And Tana has the advantage here because of 'named edges'.
Imo, the above apps have taken a step towards incorporating graphical design, but it doesn't match the fluidity of thinking that can be done on pen-and-paper. The connections made in graphs must carry the same weight as actual bidirectional links. The problem is figuring out how...
Could we have predefined connectors like parent-sibling connectors (implying superset/subset), sequence connectors (implying causation/sequence/time), and so forth? And then the other question is how do we retrieve a part of the graph? How would a node look like?
I think in a world where AI is really picking up, the graphview would become a competitive advantage (until at least AI doesn't become fully multimodal yet)
Things like these just do not translate well into text:
What about also adding these as views?
The mind map screenshot really made me think that these could also be implemented as views for nodes and to act as kind of a local graph or mind map.
It's difficult, because how would you represent this kind of graphic without knowing some form of 'code'? Some of the forking, would be difficult to replicate especially in layers. You'd probably need to know mermaidjs or something else funky. I think Tana would do well if it could rethink the whole canvas thing that other apps are putting out and really integrating it directly into the data structure.
Two use cases can be further referenced:
1- Larksuite Wiki https://www.larksuite.com/en_us/product/wiki allows switching Outline and Mind Map modes very conveniently => Watch the video for details: https://youtu.be/CWNbMpGjOtk
2- Tiago Forte uses https://milanote.com/ in this video https://youtu.be/RUKGZdJUiRU also worth a reference
Here is another example of a visual graph, but this time a data framework for LLM is implementing it - https://twitter.com/jerryjliu0/status/1667196226255884289
After listening to 2023 June 29's AMA, I've been invited to cast my vote for this feature
I just came across the best implementation I've seen so far. I hope Tana can implement something similar (from @0:08):
Anytype Beta Preview Video
Yes, Heptabase also has very impressive Visual Graph in this Video https://youtu.be/66Bn4xrshog
Also want to add anytype's knowledge graph examples, but found that someone has already mentioned it. In addition, there is also a good representation in the form of an Obsidian plugin: (obsidian-3d-graph)
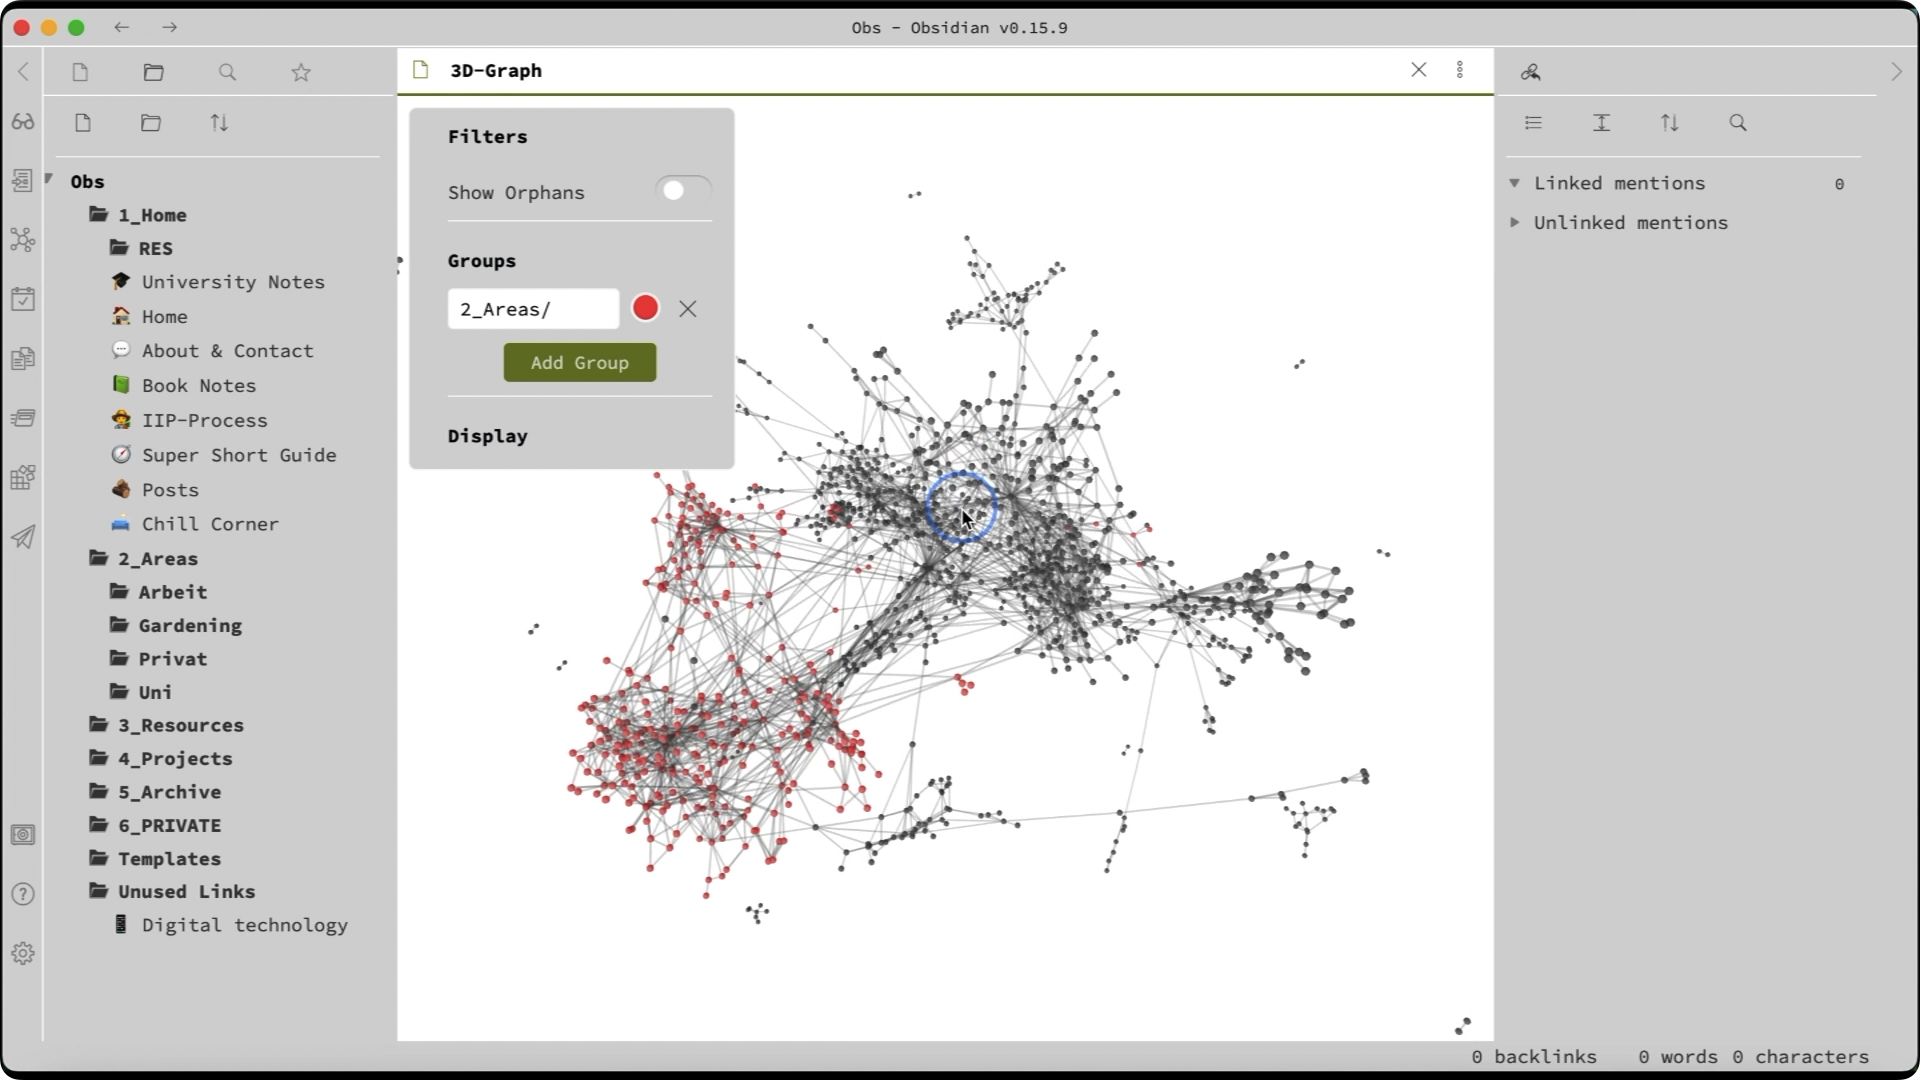
I really like this 3D effect.
Explain the problem as you see it ?
The current views , lists, tables, kanban etc. Work but they are slow and tend to 'bury me in the weeds' Especially when also trying to surface the tasks under these projects to decide on the next physical piece of work to execute.
Why is this a problem for you?
I have a lot of open projects at any given time. Let's say 100. Choosing which projects to focus my time on each day is difficult with this number.
Suggest a solution
Provide an infinite canvas that allows any node to be placed anywhere. So that projects can be 'clustered' together on the canvas by simple dragging and dropping.
I would also like to be able to embed search queries and then drag nodes from of the result of the query to anywhere on the canvas
Here's a video explaining the infinite canvases in Scrintal and Obsidian Canvas (https://youtu.be/QF7pwZxAOxo?si=85ISzPBL22bNkE7w)
I've always thought TheBrain's implementation of a graph view/navigation was very useful. TheBrain supports three relationships for each item: parent, child, and sibling. The UX is such that the node navigation is on the left, and the details of whatever you have selected are on the right. So, it's not just a popularity contest of how many nodes reference or link to another node, but it visually represents the semantic relationship between the nodes. But at the same time, it allows you to read the contents of that node.
I'm hoping we can filter any graph view in Tana by several factors, such as semantic relationships, links and references in/out, hierarchical location (parent/children), supertag, field values, etc.
Looking forward to the Graph view feature
A graph visualization is one of the first things I tried to do and I was surprised to see that it wasn't possible. This was something I assumed Tana could do and I hope it is implemented soon. Great job on a beautiful app so far!
Great visual graph implementation _"I took all 4898 of my notes and visualized them in clusters using Al" _https://www.reddit.com/r/PKMS/s/ugiQV4t3Dq
It would be great to know if Something like infinite canvas / visual graph / whiteboard functionality is on the cards.
I use Tana daily and love it, slowly building a system for everything I do, work-related and otherwise. But I find myself increasingly copying several nodes into Heptabase and rebuilding connections there as the whiteboard functionality is a key component of processing and connecting ideas. Then I bring what I generate back to Tana to connect it to the rest of my graph. I enclose an example of what I do with Heptabase to help me understand or develop ideas.
Heptabase is not as powerful as Tana when it comes to customising your workspace and evolving the schema or using AI, but it is quickly adding very effective components to its excellent whiteboard function, such as journaling and supertags.
I know there are many other products trying similar things, but I believe that Tana and Heptabase have the advantage in their respective strengths. At the moment I am happily paying for both but that also means a lot of work to move my data back and forth. A single environment combining the two sets of functionalities would be amazing. I'd love to hear what the Tana team is thinking about this.
Useful insights. I hope a whiteboard, visual graph, or a combination is in the works for Tana.
Another amazing graph implementation on https://www.getrecall.ai. Check out the video below 'Recall in 2 minutes' starting at 1:50 mins.