Agreed! I end up using Roam's (improved) graph view in different cases than the canvas.
A couple of updates:
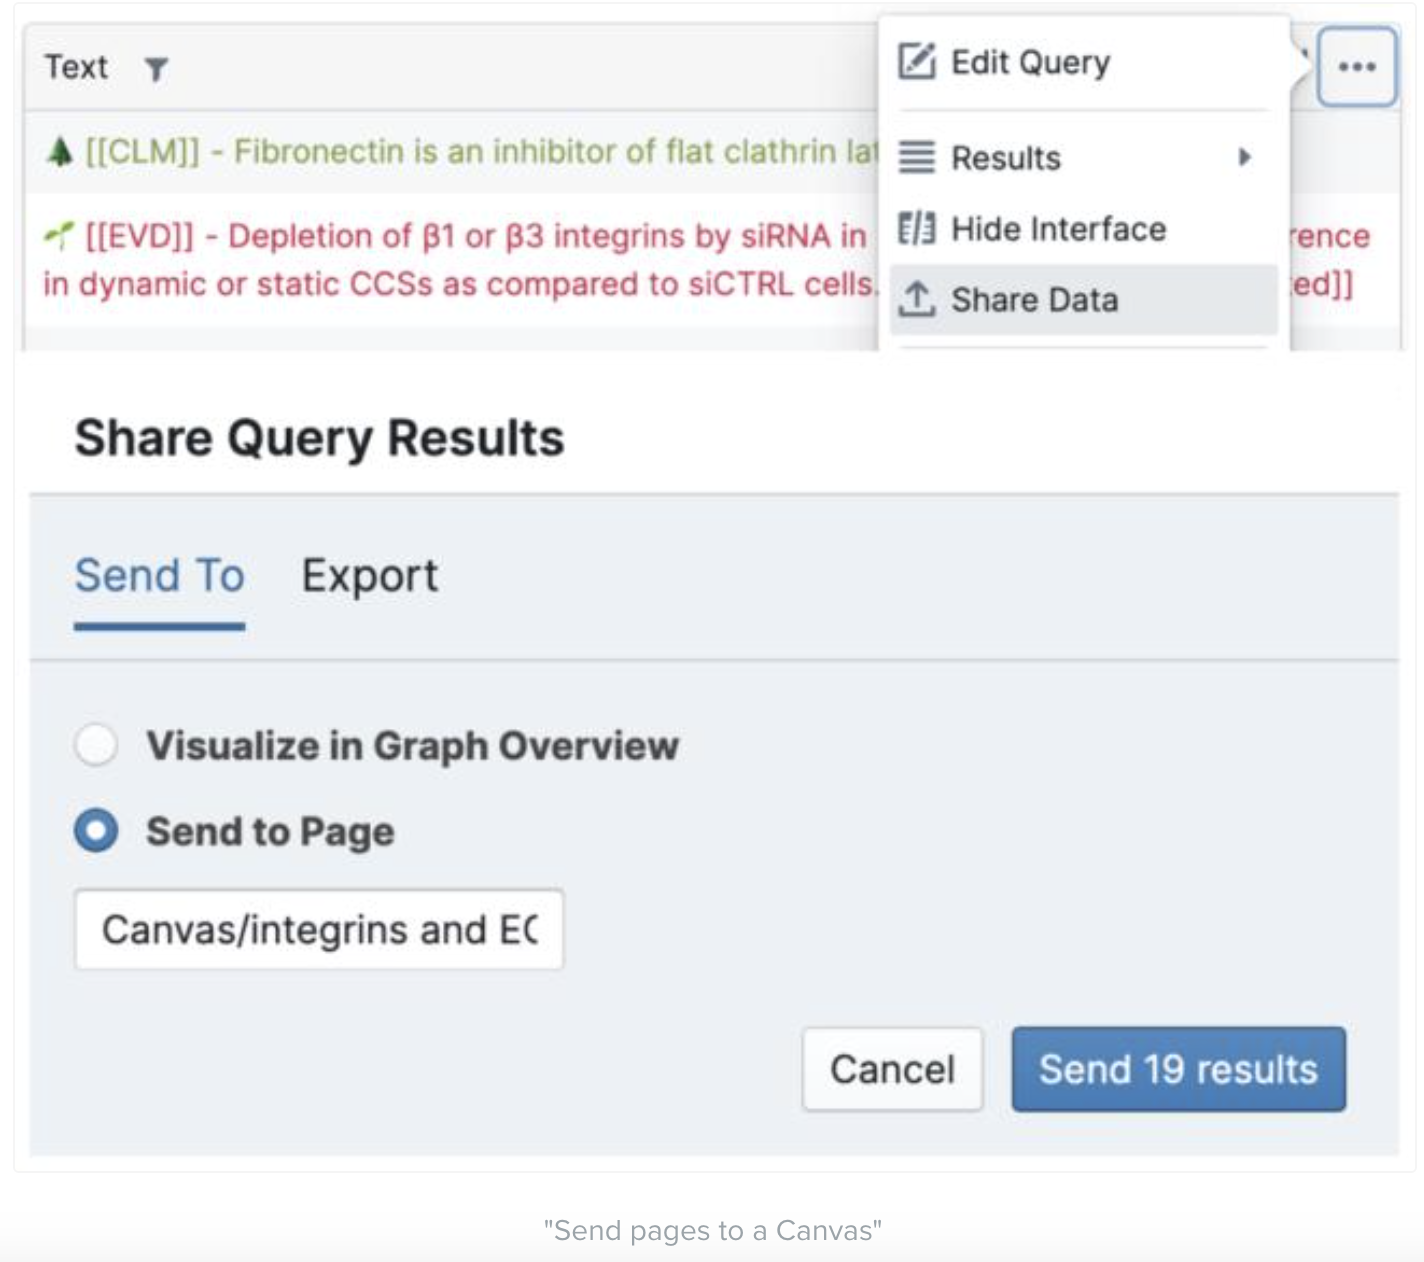
One killer app has been to take the results of a query and dump them into a canvas.
This lets us array e.g. a set of projects on the canvas and spatially categorize, etc.
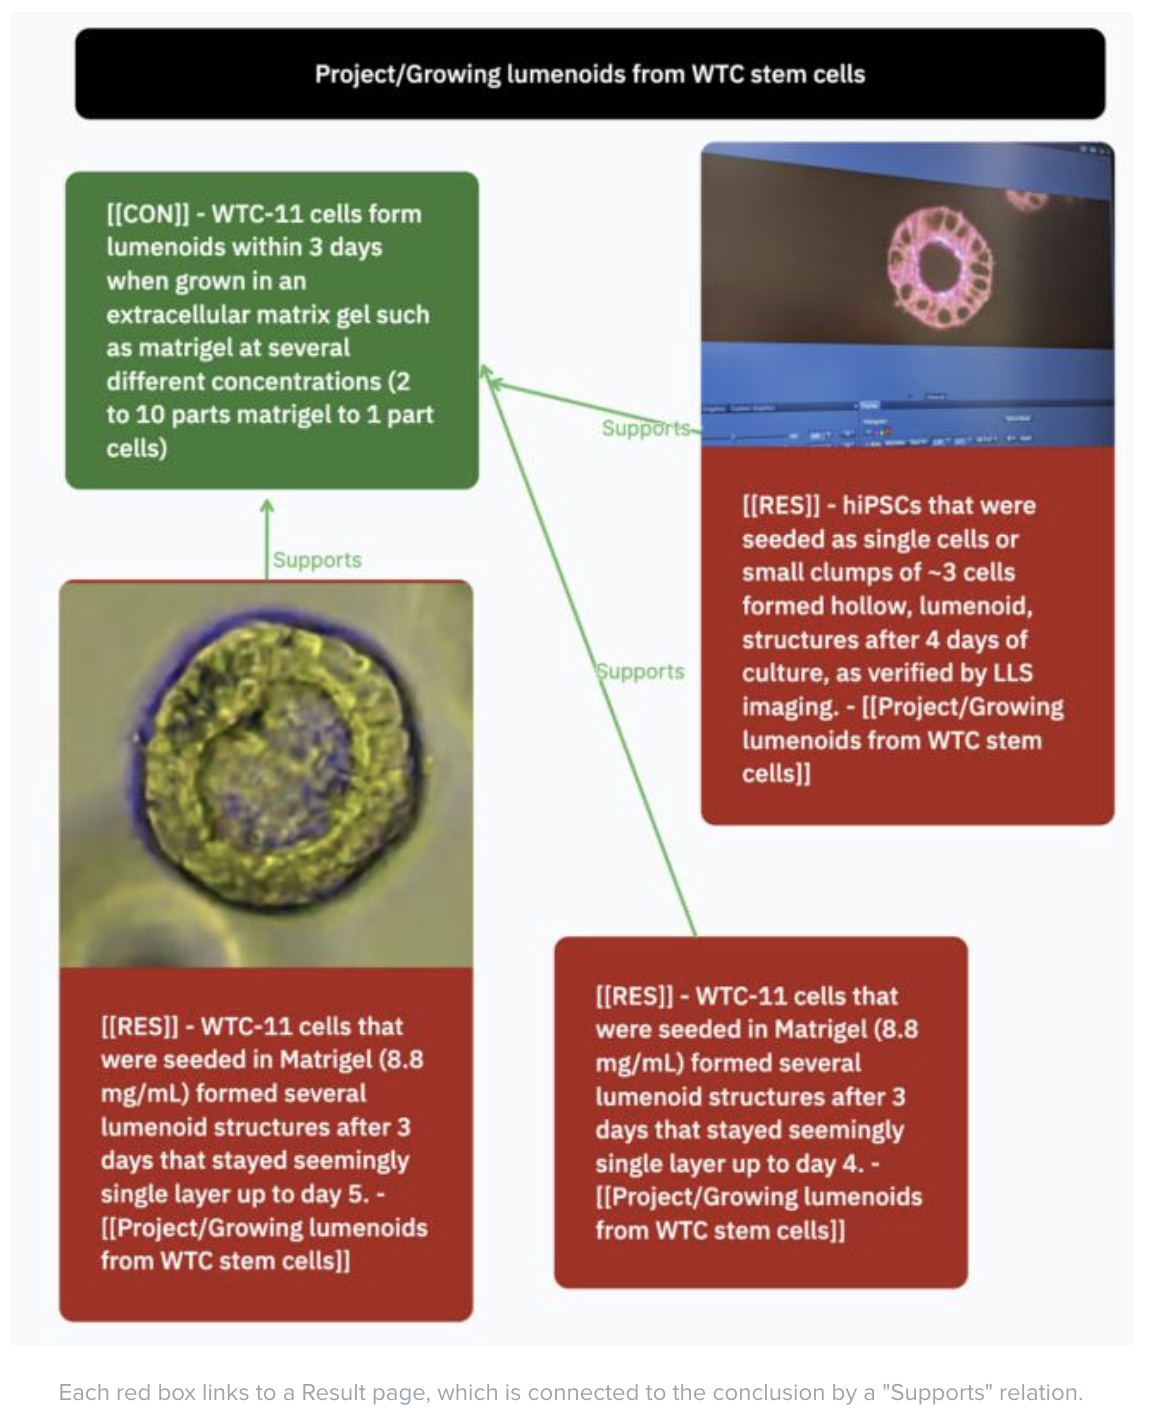
The canvas now includes "key figure" images which are pulled from the first image associated with the nodes. This has increased utility of the canvas by a lot!
I wrote up some examples for how we use the canvas on experiment.com if useful!
You don't have permission to do this.
You're going a bit too fast! Take a break and try again in a moment.
Something went wrong! Please reload the page and try again.
Agreed! I end up using Roam's (improved) graph view in different cases than the canvas.
A couple of updates:
One killer app has been to take the results of a query and dump them into a canvas.

This lets us array e.g. a set of projects on the canvas and spatially categorize, etc.
The canvas now includes "key figure" images which are pulled from the first image associated with the nodes. This has increased utility of the canvas by a lot!

I wrote up some examples for how we use the canvas on experiment.com if useful!