Explain the problem as you see it
I want to debug my taxonomy a bit, but it would help to have an overview available. With so many tags and field constellations connected via extensions and instances, keeping up with the structure isn't easy.
Why is this a problem for you?
Well, taxonomy is everything.
Suggest a solution
A network graph - a visual description of the connections. (note! I'm not recommending a network graph of nodes - just supertags and how they connect via extensions or field instances)

14 Comments
I'd absolutely love this.
I desperately need to re-factor my Supertag structure that's just developed ad-hoc since I started using Tana. I'd like to redo it and make it fit the way I now know I need to organise my Tana Workspace.
This sounds great. Could be a re-workup of the Schema page essentially, which currently only acts like a dumping ground
"Tagsonomy" 😬
Currently keeping track of this manually in Draw.io - would love this automatic solution :)
One major goal of a visual representation would be to enable refactoring. I think as your Tana graph grows and you realize you need to change supertags around or break things down or perhaps introduce new ways of structuring data, it's really hard to get a mental model of the super tag hierarchy and fields (especially when working across multiple workspaces). Then there needs to be an easy way to see what content is impacted by changes. Overall I feel like Tana becomes more brittle the more it grows.
Yep, just seeing the supertags as a graph would already be super useful vs the regular requests of getting a graph of everything, which is hardly useful (as many existing apps have shown)
I, too, consider this essential.
Attempting to understand these relationships today is an extremely tedious manual process. My current attempt to make an automated visual solution is not yet functional. And it still has the manual step of finding all tags and fields locally, then copying and pasting a text file. I post-process the file with Wolfram Mathematica (probably a rare tool among Tana users).
This is also my greatest wish for Tana to implement. I don't know of any better tool for creating and iterating over models than Tana already, but adding the visualization part would take it to god tier. Not least when describing and sharing models with others. This kind of visualization (tag- and field relationships) would be so much more useful for me than a simple node graph that so many other tools have.
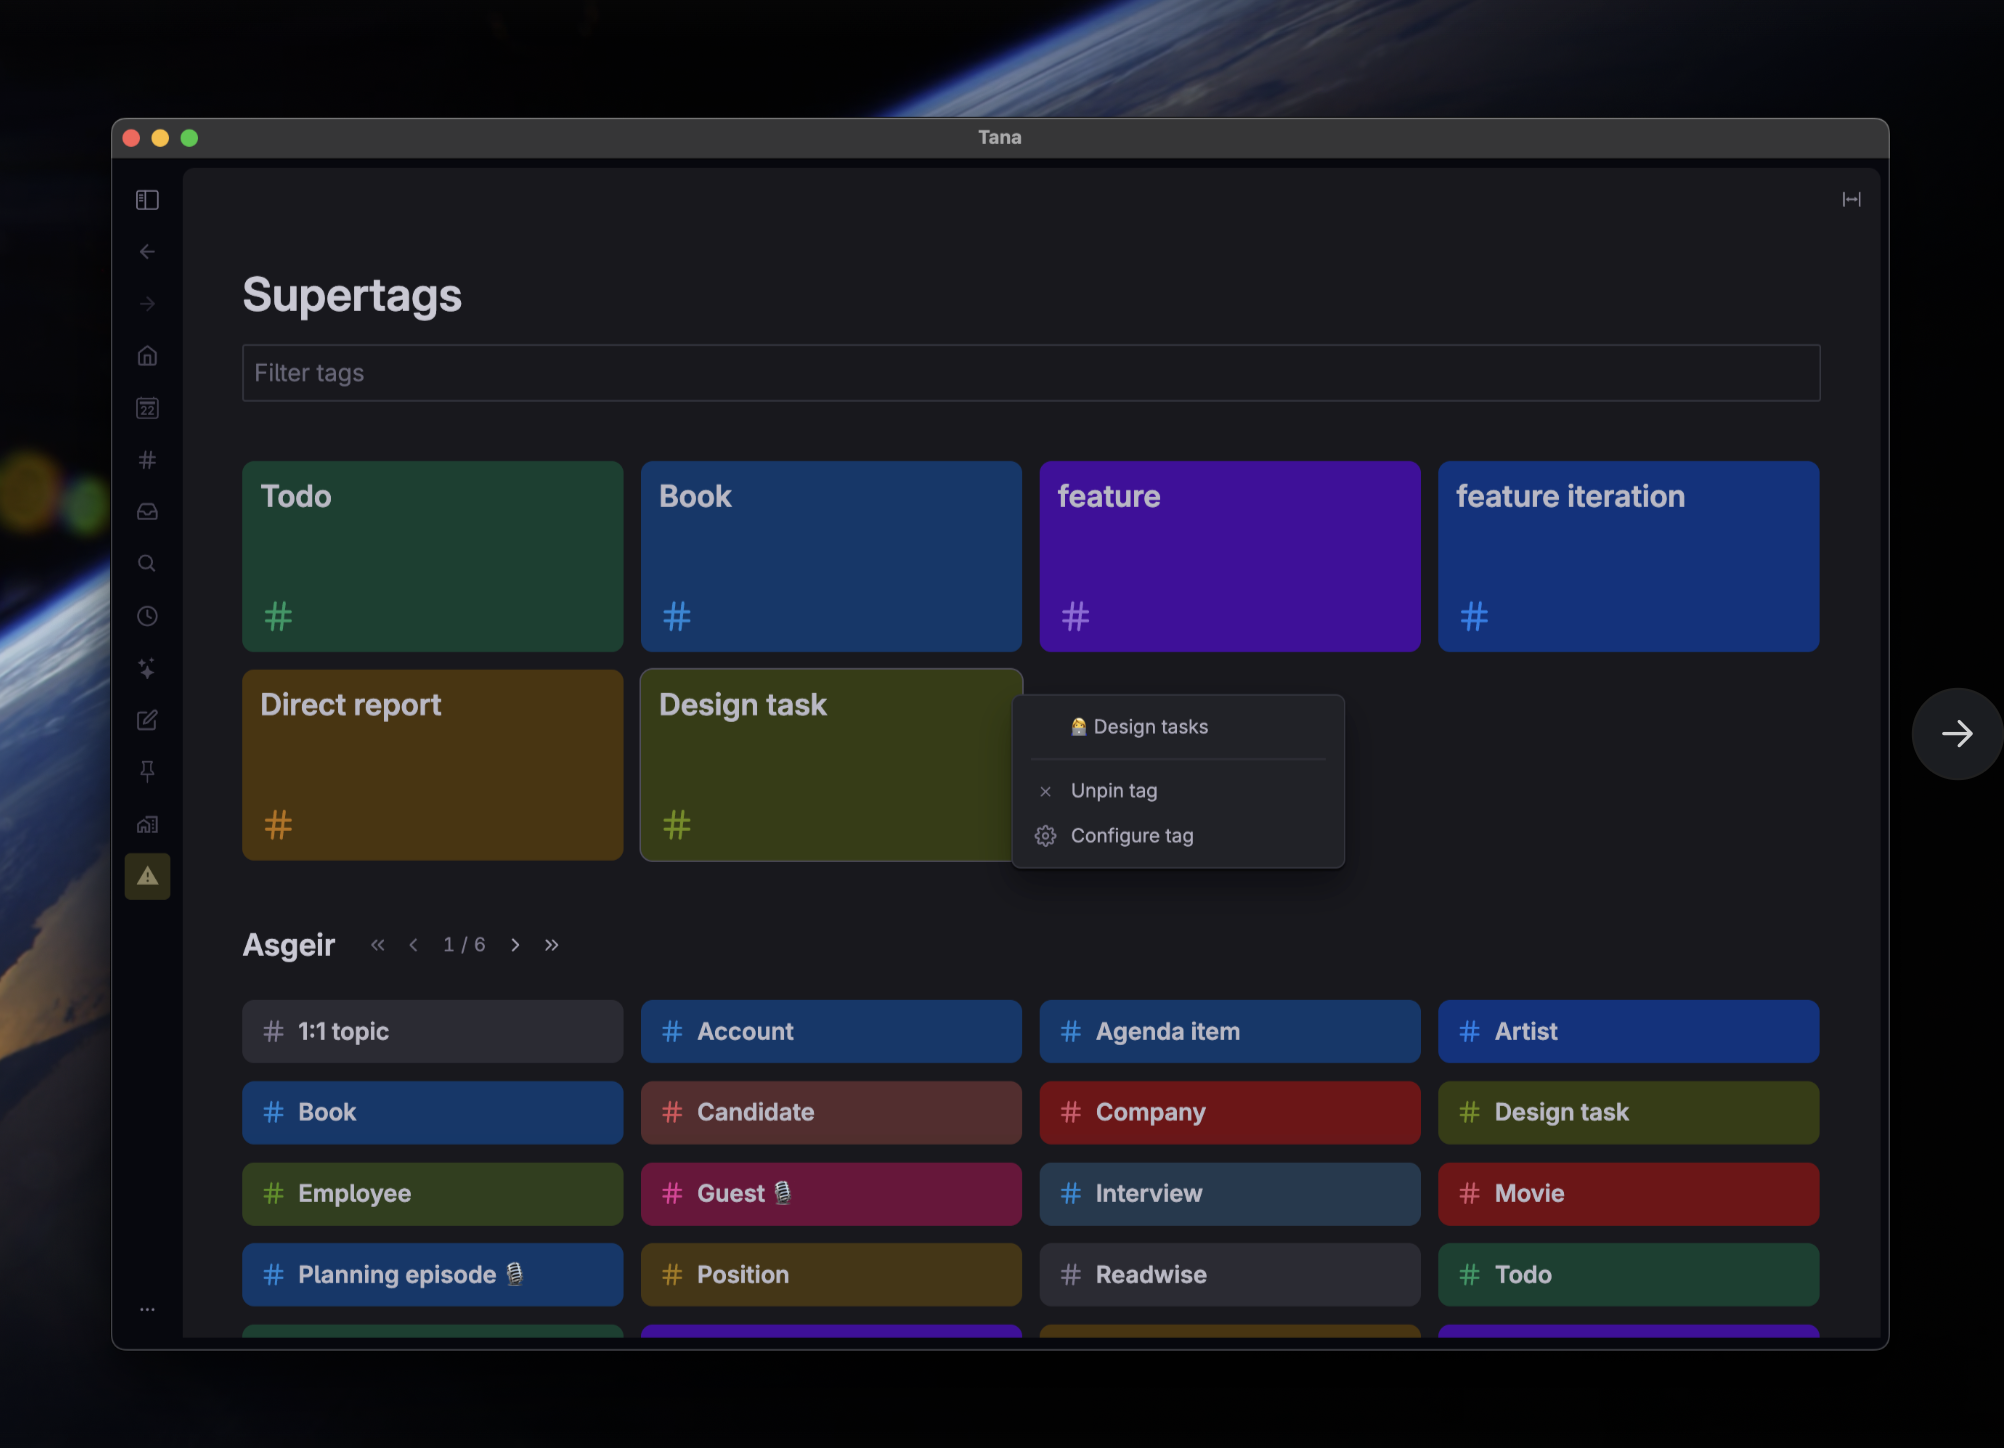
Excellent ideas. This is an area the team have explored significantly particularly with mobile release, and with the recently released supertag view bringing this to desktop. More to come in future chapters
Hi @Matt M , would you mind elaborating how that view helps "debugging the taxonomy", which is one of the main requests? I like the viz itself, I just don't quite understand how it helps me understand the connection and relations between supertags I'm afraid
Yes @MJ B this is one for future. Prominence of Supertag view within sidebar a sign of it's importance, but it doesn't yet do the things requested so it's classified as likely future exploration. Lots of great ideas in this submission to consider.
As this item seems to have traction, I'd like to bump my Matrix idea up here, as I think the concept could support this idea. It would allow for a sleek way to view supertags from different angles.
For example:
Any more updates on this? This is probably the primary reason I keep leaving tana to try other tools. I am not able to hold the schema in my head and at least for me. I am not able to find a way to visualize it well. The popout panels are great but just not sufficient to be able to see the broader landscape. At best I am able to open 3-4 sidepanels with the supertag details before I can't go further.